Figures & data
Figure 1 Morphology and size distribution of Fe3O4@C.
Notes: (A) Transmission electron microscopy; (B) dynamic light scattering analysis of particles; and (C) energy-dispersive X-ray spectroscopy mapping of elements for Fe3O4@C shown in (A).
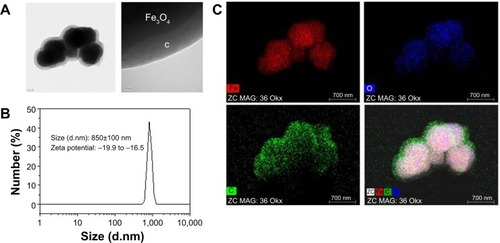
Figure 2 Structural analyses of Fe3O4@C.
Notes: (A) Powder X-ray diffraction pattern; (B) Raman spectrum; (C) ultraviolet/visual/NIR absorbance spectrum; (D) magnetization curve by SQUID.
Abbreviation: NIR, near-infrared.
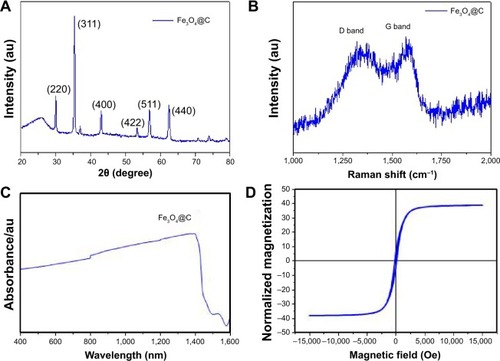
Table 1 Carbon and nitrogen contents of magnetic nanoparticles
Figure 3 Cytotoxicity and cellular uptake of Fe3O4@C particles.
Notes: (A) Cytotoxicity 3-(4,5-dimethylthiazol-2-yl)-5-(3-carboxymethoxyphenyl)-2-(4-sulfophenyl)-2H-tetrazolium (MTG) assay; (B) relative concentration of Fe-exposed cell extracts compared to the control cells; (C) bio–transmission electron microscope analysis to identify the cellular uptake.
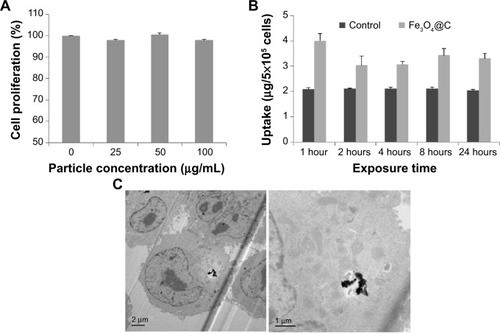
Figure 4 Photothermal effect of Fe3O4@C particles on A549 cells.
Abbreviations: NIR, near-infrared; OD, optical density.
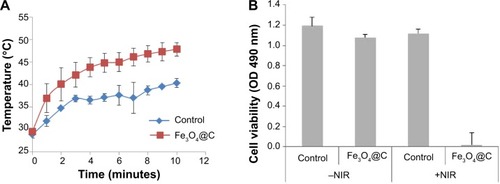
Figure 5 In vivo NIR (808 nm) irradiation experiment after intratumoral administration of Fe3O4@C particles (5 mg·kg−1).
Notes: (A) The changes of the tumor sizes are shown in the whole body (upper), and in the tumor mass excised after sacrifice (down). (B) Temperature changes on the tumor xenograft for NIR irradiation. (C) Change in tumor volume (0.5× W × L2, where L is the tumor length and W is the tumor width) was calculated by subtraction of the volume before irradiation from the volume on the final day before sacrifice (**P<0.01; n=3).
Abbreviation: NIR, near-infrared.
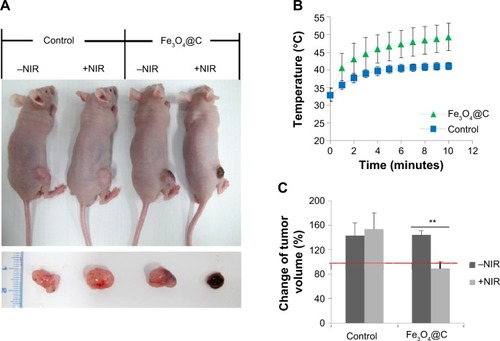
Figure 6 Histology of the tumor xenograft excised following (+)/(−)NIR irradiation, stained with hematoxylin–eosin.
Note: Tissue sections images were captured at 400× magnification.
Abbreviation: NIR, near-infrared.
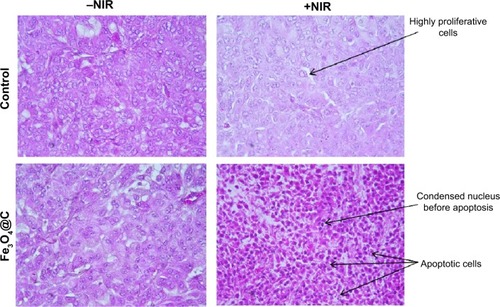
Figure 7 Tumor-specific distribution of Fe3O4@C particles.
Notes: (A) Distribution of Fe in various tissues analyzed by inductively coupled plasma atomic emission spectroscopy. Iron concentration in mouse tissues following injection with Fe3O4@C particles (5 mg kg−1) are compared to control tissues (*P<0.05; n=3). A significant increase of Fe distribution over red line (Fe ratio =1) is seen only in tumor tissue. (B) Distribution of Fe3O4@C particles analyzed by Prussian blue staining of iron particles in tumor tissue. Images of tissue sections were captured at 400× magnification.
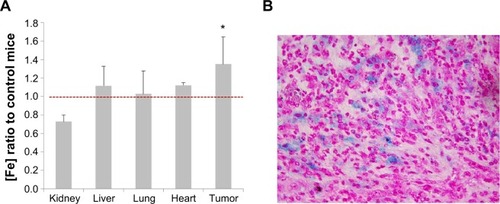
Figure S1 Size distribution of Fe3O4@C particles by dynamic light scattering.
Notes: (A) Intensity distribution of Fe3O4@C particles. (B) Size distribution of Fe3O4@C particles without sonication.
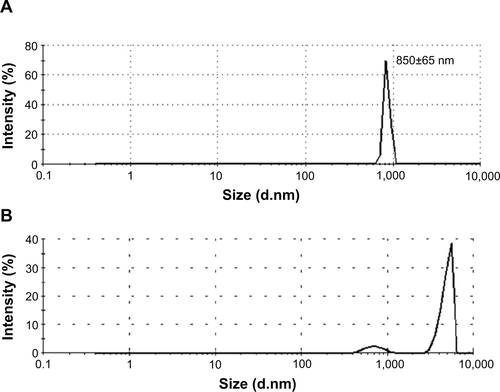
Figure S2 Cytotoxicity Fe3O4@C particles for mouse AML 12 cells.
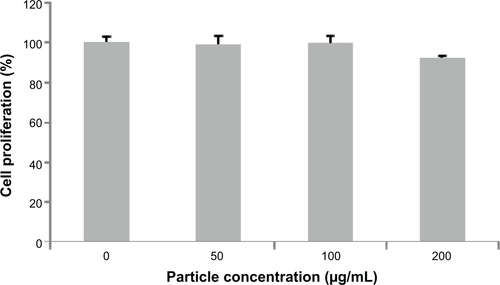
Figure S3 Histological analysis of heart, liver, lung, and kidney tissues following an injection of Fe3O4@C and NIR irradiation.
Note: Images were captured at 400× magnification.
Abbreviation: NIR, near-infrared.
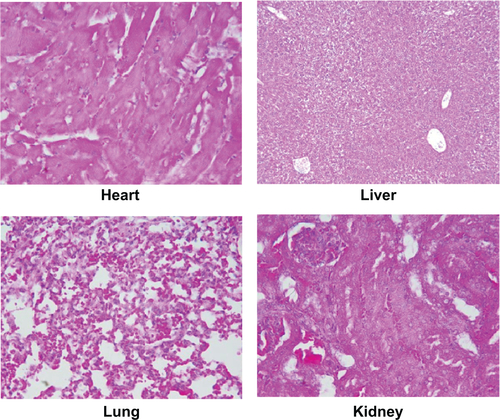
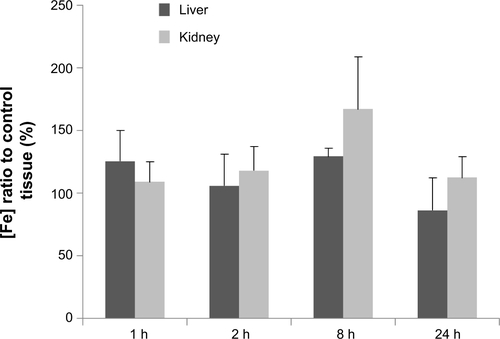
Figure S4 Distribution of Fe3O4@C in liver and kidney analyzed by ICP-MS.
Notes: Iron concentration in mouse tissues following intravenous injection with Fe3O4@C particles (5 mg kg−1) compared to control tissues.
Abbreviations: ICP-MS, inductively coupled plasma-mass spectrometry; h, hours.