Figures & data
Table 1 Characteristics of blank and drug-loaded NPs
Figure 1 The particle size distribution and zeta potential of DOX/Cur-NPs.
Notes: (A) Particle size distribution and (B) zeta potential.
Abbreviations: d, diameter; DOX/Cur-NPs, doxorubicin and curcumin codelivery lipid nanoparticles.
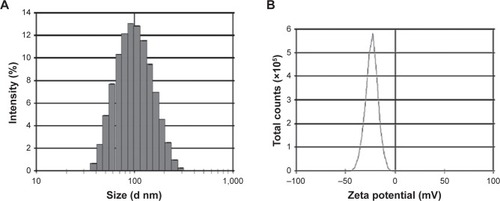
Table 2 Drug loading and encapsulation efficacy
Figure 2 Transmission electron microscopy photographs of DOX/Cur-NPs.
Notes: Scale bar =500 nm; inset, scale bar =100 nm. Inset, higher magnification.
Abbreviation: DOX/Cur-NPs, doxorubicin and curcumin codelivery lipid nanoparticles.
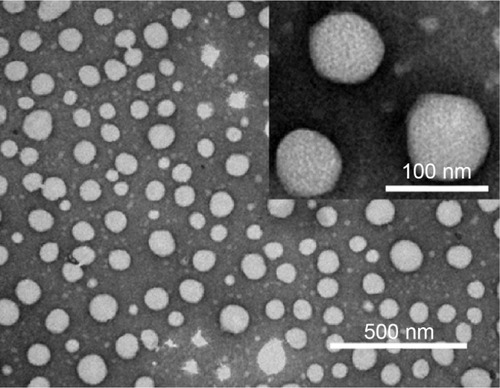
Table 3 DSC parameters
Figure 3 Differential scanning calorimetry curves of DOX/Cur-NPs, blank NPs, Precirol ATO 5®, DOX, Cur, and a physical mixture of Precirol ATO 5, DOX, and Cur.
Abbreviations: Endo, endotherm; NPs, lipid nanoparticles; DOX/Cur-NPs, doxorubicin and curcumin codelivery lipid nanoparticles; DOX, doxorubicin; Cur, curcumin.
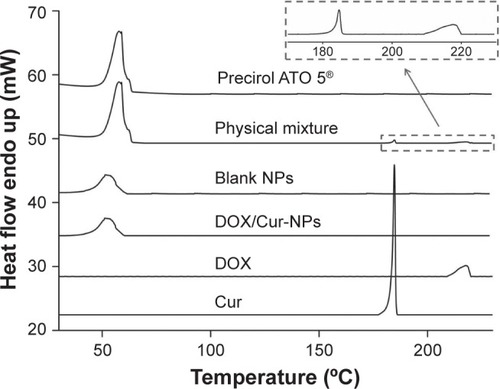
Figure 4 X-ray diffraction patterns of DOX/Cur-NPs, blank NPs, Precirol ATO 5®, DOX, Cur, and a physical mixture of Precirol ATO 5, DOX, and Cur.
Abbreviations: DOX, doxorubicin; Cur, curcumin; NPs, lipid nanoparticles; DOX/Cur-NPs, doxorubicin and curcumin codelivery lipid nanoparticles.
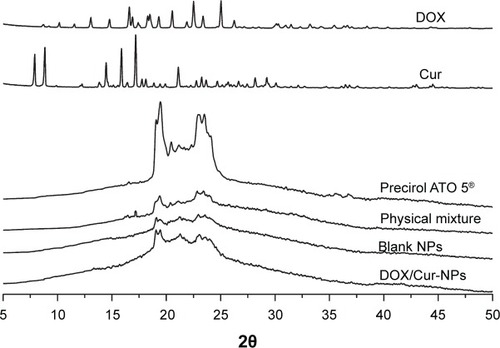
Figure 5 Cumulative release profiles of DOX and Cur.
Notes: (A) DOX; (B) Cur. The experiment was performed using the dialysis bag diffusion technique at 37°C. Results are expressed as the mean ± SEM (n=3).
Abbreviations: DOX, doxorubicin; DOX-NPs, doxorubicin-loaded lipid nanoparticles; DOX/Cur-NPs, doxorubicin and curcumin codelivery lipid nanoparticles; Cur, curcumin; Cur-NPs, curcumin-loaded nanoparticles; SEM, standard error of the mean; n, number.
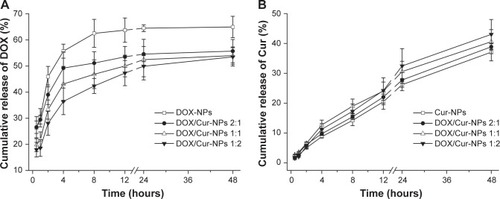
Table 4 The regression equation of the DOX and Cur in vitro release
Figure 6 Cytotoxic effect of blank NPs in HepG2 cells and L02 cells.
Notes: (A) HepG2 cells; (B) L02 cells. Cells were treated with 10–75,000 μg/mL of blank NPs for 48 hours. Cell viability was assessed by MTT assays and the results are presented as a ratio of control.
Abbreviations: C, concentration; NPs, lipid nanoparticles; MTT, 3-(4,5-dimethylthiazol-2-yl)-2,5-diphenyltetrazolium bromide.
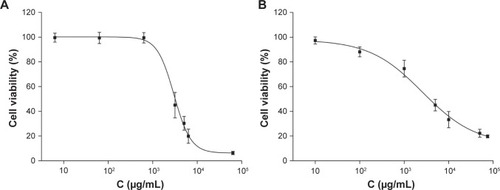
Table 5 IC50 of DOX in HepG2 and L02 cells
Figure 7 Cell viability of HepG2 cells and L02 cells.
Notes: (A) HepG2 cells; (B) L02 cells. Cells were exposed to different concentrations (0.01–400 μg/mL) of free DOX, DOX+Cur (1:1), DOX-NPs, or DOX/Cur-NPs (2:1, 1:1, 1:2) for 48 hours, respectively. Cell viability was assessed by MTT assays and the results are presented as a ratio of control.
Abbreviations: DOX, doxorubicin; DOX-NPs, doxorubicin-loaded lipid nanoparticles; DOX/Cur-NPs, doxorubicin and curcumin codelivery lipid nanoparticles; C, concentration; DOX+Cur, physical mixture of doxorubicin and curcumin; MTT, 3-(4,5-dimethylthiazol-2-yl)-2,5-diphenyltetrazolium bromide.
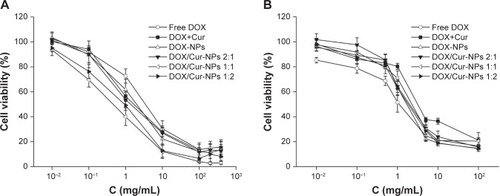
Figure 8 Annexin-V/PI double-staining assay in HepG2 cells.
Notes: After treating with DOX, DOX+Cur (1:1), DOX-NPs, and DOX/Cur-NPs (1:1) for 24 hours, HepG2 cells were stained with Annexin V-FITC and PI and analyzed by fluorescence microscopy. Green: stained with Annexin V-FITC; red: stained with PI; mixture: stained with both Annexin V-FITC and PI. Apoptotic cells were highlighted by FITC, PI, and their merged images. Scale bar =50 μm.
Abbreviations: FITC, fluorescein isothiocyanate; PI, propidium iodide; DOX, doxorubicin; DOX+Cur, physical mixture of doxorubicin and curcumin; DOX-NPs, doxorubicin-loaded lipid nanoparticles; DOX/Cur-NPs, doxorubicin and curcumin codelivery lipid nanoparticles.
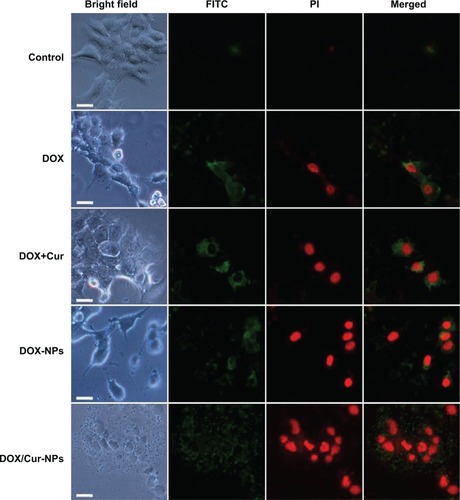
Figure 9 In vivo tumor growth inhibition.
Notes: (A) Representative images of livers from different treatment groups at the 36th week. The red arrow pointed to the tumor nodule. (B) Number of tumors on the liver surface (diameter ≥1 mm). Five livers in each group were calculated. (C) Maximum tumor size (diameter, mm). Maximum tumor size on the surface of each liver was measured. The results represented the mean value of the maximum tumor size in five livers from each group. The results are expressed as the mean ± SEM (n=5). *P<0.05, **P<0.01, ***P<0.001, one-way ANOVA.
Abbreviations: DOX-NPs, doxorubicin-loaded lipid nanoparticles; DOX/Cur-NPs, doxorubicin and curcumin codelivery lipid nanoparticles; SEM, standard error of the mean; n, number; ANOVA, analysis of variance.
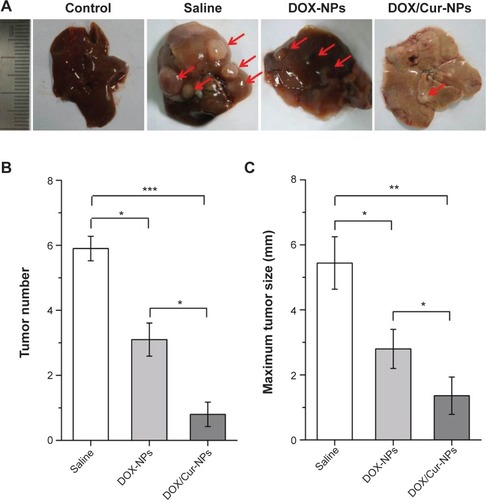
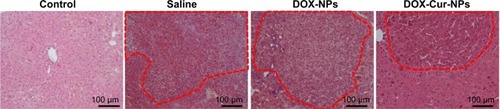
Figure 10 Histological analysis of livers from the control group, saline group, DOX-NP group, and DOX/Cur-NP group.
Notes: Histological analysis of the livers was performed by hematoxylin and eosin staining. Tumor nodules were highlighted by a red outline. Scale bar =100 μm.
Abbreviations: DOX-NPs, doxorubicin-loaded lipid nanoparticles; DOX/Cur-NPs, doxorubicin and curcumin codelivery lipid nanoparticles.