Figures & data
Figure 1 Histogram of titanium oxide-nanoparticle (TiO2NP) size distribution. The predominant size for TiO2NPs ranged from 10 to 15 nm. The size distribution was obtained from six independent dynamic light scattering measurements.
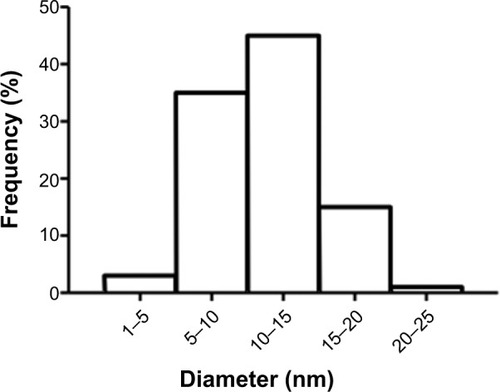
Figure 2 Distribution of titanium oxide nanoparticles (TiO2NPs) in hFOB 1.19 cells.
Notes: (A) Arrows indicate TiO2NP (50 μg/mL) uptake by cells following 24 hours’ incubation. (B) A representative image of the osteoblasts showing normal cell ultrastructure after incubation with nanoparticles (NPs) at 50 μg/mL for 24 hours. (C) Altered mitochondrial morphology after 48 hours’ exposure to TiO2NPs (50 μg/mL). Arrows indicate mitochondrial profiles with condensed matrix. (D) Ultrastructural evidence of the presence of NPs within the cell after 24 hours’ exposure to TiO2NPs. Note aggregates of TiO2NPs inside the cell vacuoles. Arrow indicates internalization of nanoparticles.
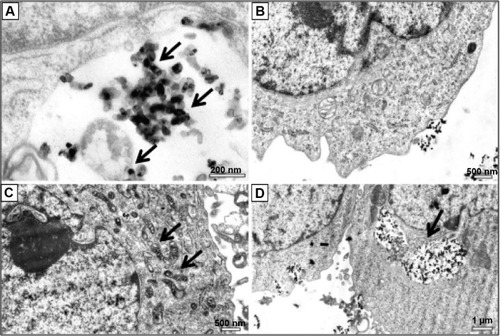
Figure 3 Ultrastructural features of osteoblasts incubated with 100 μg/mL titanium oxide nanoparticles (TiO2NPs) for 48 hours.
Notes: (A) Intensive cytotoxic vacuolization of mitochondria. (B) Autophagolysosomes with remnants of organelles. Arrow indicates well-developed Golgi apparatus. (C) Vacuolization of cytoplasm. (D) Cell undergoing necrosis showing disintegration of cytoplasmic membrane and electron-lucent nuclear chromatin.
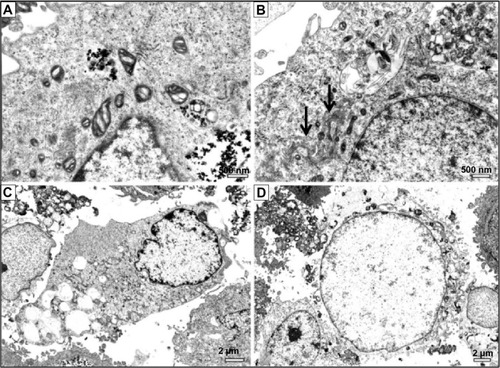
Figure 4 Increased generation of superoxide anion (O2•−) in hFOB 1.19 cells following exposure to titanium oxide nanoparticles (TiO2NPs).
Notes: Data shown are means ± standard deviations of triplicate determinations from four independent experiments. *P<0.05; ***P<0.001; treatments vs control.
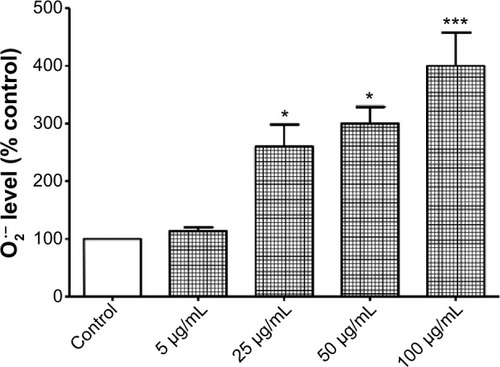
Figure 5 Reduction of superoxide dismutase (SOD) activity by titanium oxide nanoparticles (TiO2NPs) in hFOB 1.19 cells. The exposure of cells to TiO2NPs decreased SOD activity.
Notes: Data shown are means ± standard deviations of duplicate determinations from four independent experiments. **P<0.01 compared with control.
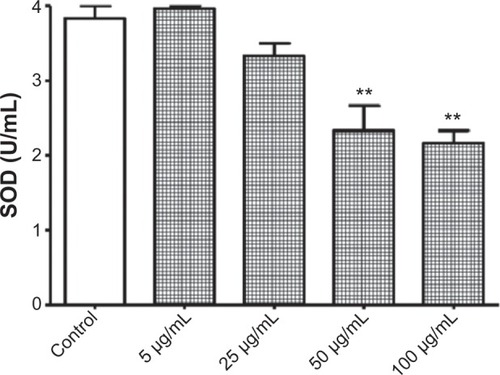
Figure 6 Reduction of superoxide dismutase (SOD) protein levels by titanium oxide nanoparticles (TiO2NPs) in hFOB 1.19 cells. The exposure of cells to TiO2NPs decreased SOD1 (A) and SOD2 (B) protein levels. Insets show representative immunoblots.
Notes: Data shown are means ± standard deviations of triplicate determinations from three independent experiments. *P<0.05; **P<0.01; compared with control.
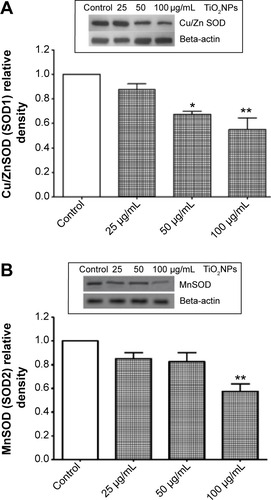
Figure 7 Reduction of sirtuin 3 (SIR3) protein levels by titanium oxide nanoparticles (TiO2NPs) in hFOB 1.19 cells. The treatment of cells with TiO2NPs decreased SIR3 protein levels. Inset shows a representative immunoblot.
Notes: Data shown are means ± standard deviations of triplicate determinations from three independent experiments. **P<0.01; compared with control.
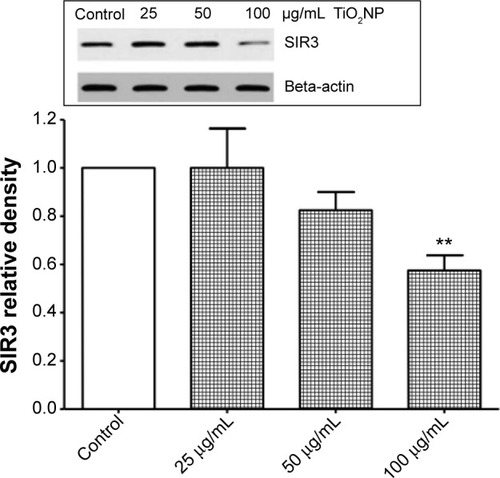
Table 1 Pearson’s correlation coefficient between sirtuin 3 (SIR3) and manganese superoxide dismutase (MnSOD)/superoxide anion (O2•−)
Figure 8 Reduction of total antioxidant capacity (TAC) by titanium oxide nanoparticles (TiO2NPs) in hFOB 1.19 cells.
Notes: Data shown are means ± standard deviations of triplicate determinations from three independent experiments. *P<0.05; ***P<0.01; compared with control.
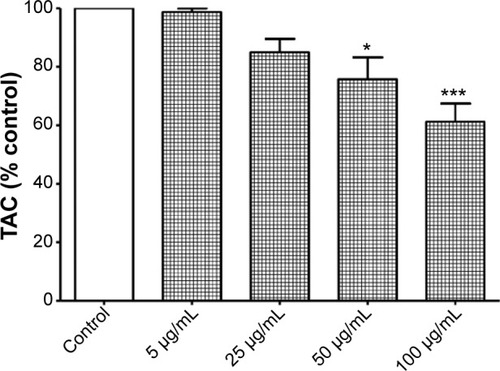
Figure 9 Increased levels of malondialdehyde (MDA) following exposure to titanium oxide nanoparticles (TiO2NPs) in hFOB 1.19 cells.
Notes: Data shown are means ± standard deviations of triplicate determinations from three independent experiments. *P<0.05; ***P<0.001; treatments vs control.
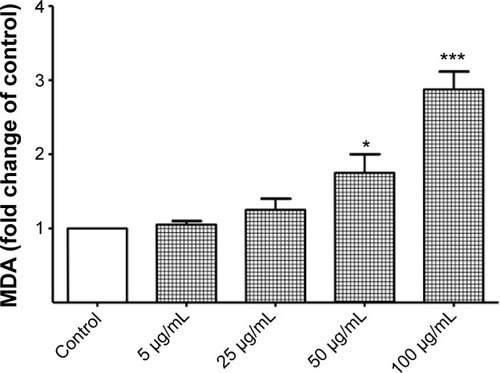
Figure 10 Reversal of titanium oxide-nanoparticle (TiO2NP)-induced cytotoxicity by superoxide dismutase (SOD) in hFOB 1.19 cells. SOD attenuates TiO2NP-induced decrease in cell viability (A), alkaline phosphatase (ALP) activity (B), and increase in malondialdehyde (MDA) production (C).
Notes: Data shown are means ± standard deviations of triplicate determinations from three independent experiments. *P<0.05; **P<0.01; ***P<0.001; TiO2NPs-treated cells vs TiO2NPs-treated cells in the presence of SOD.
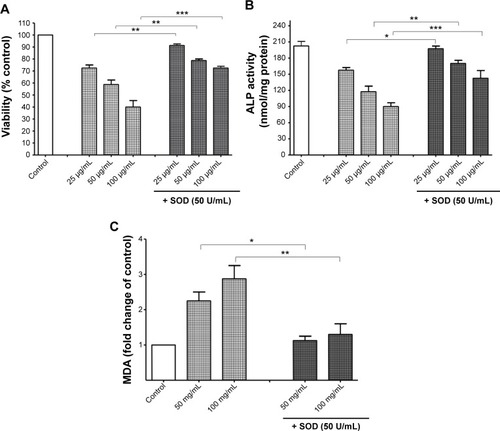
Figure S1 A preliminary concentration–response study. Cell viability after 24 hours’ treatment with titanium oxide nanoparticles (TiO2NPs) (5, 50, 250, and 500 μg/mL). The exposure of cells to TiO2NPs for 24 hours decreased hFOB 1.19 cell viability.
Notes: Data shown are means of duplicate determinations from two independent experiments.
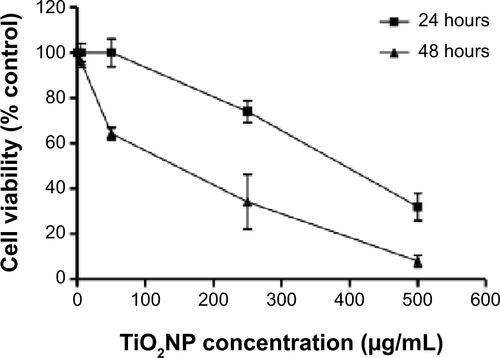
Figure S2 Cell viability after 24 and 48 hours of treatment with titanium oxide nanoparticles (TiO2NPs). The exposure of cells to TiO2NPs for 48 hours decreased hFOB 1.19 cell viability.
Notes: Data shown are means ± standard deviations of triplicate determinations from three independent experiments. *P<0.05; ***P<0.001 compared with control.
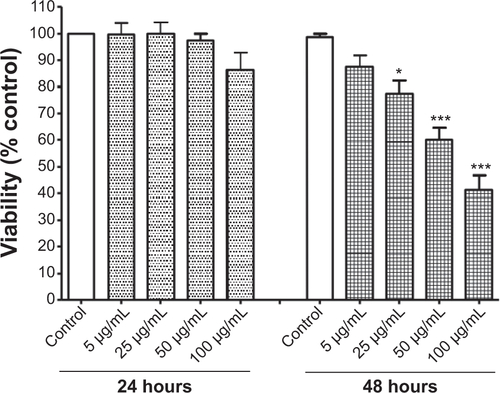
Figure S3 Titanium oxide nanoparticles (TiO2NPs) result in lactate dehydrogenase (LDH) release following 48 hours’ incubation with hFOB 1.19 cells.
Notes: Data shown are means ± standard deviations of triplicate determinations from three independent experiments. LDH release in control (untreated cells) was 9.5%±2% and this was significantly increased following treatment with TiO2NPs. *P<0.05; ***P<0.001 compared with control.
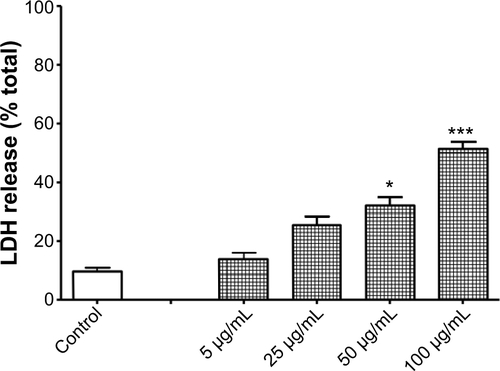
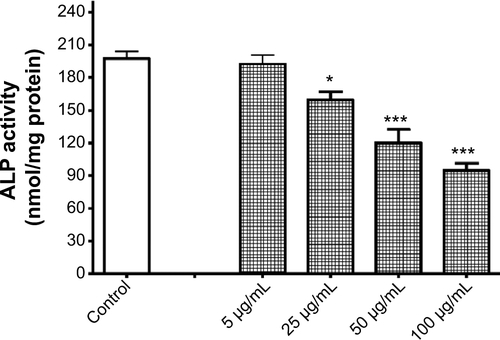
Figure S4 Reduction of alkaline phosphatase (ALP) activity by titanium oxide nanoparticles (TiO2NPs). The 48-hour treatment of cells with TiO2NPs decreased hFOB 1.19 ALP activity.
Notes: Data shown are means ± standard deviations of triplicate determinations from independent experiments done in triplicate. *P<0.05; ***P<0.001 compared with control.