Figures & data
Table 1 Real-time PCR primers used in the study
Figure 1 Characterization of the deposited diamond film.
Notes: Raman spectra (A); SEM images (B); and AFM images (C) of the deposited diamond film on the smooth side (left column) and on the rough side (right column) of the silicon substrate.
Abbreviations: SEM, scanning electron microscopy; AFM, atomic force microscopy.
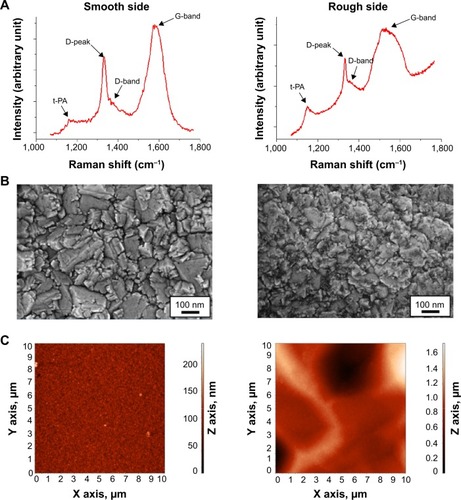
Figure 2 Wetting properties of as-grown and treated diamond films in hydrogen plasma (H-terminated) or oxygen plasma (O-terminated).
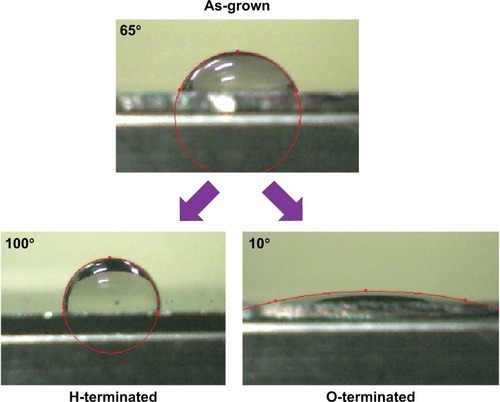
Figure 3 Cell adhesion and growth on NCD films.
Notes: Fluorescence microscopy images showing the morphology of Saos-2 cells at 24 hours and 72 hours after seeding on H-terminated NCD films, on O-terminated NCD films, and on glass; Texas Red and Hoechst staining, fluorescence microscopy (Olympus IX 51) (A). Graph showing the number of Saos-2 cells at 24 hours and 72 hours after seeding on H-terminated NCD films, on O-terminated NCD films, and on glass; seeding density was 10×103 cells/cm2. The data from ten images in each group are expressed as the mean ± SD. *Statistically significant at P≤0.05 (B).
Abbreviations: NCD, nanocrystalline diamond; SD, standard deviation.
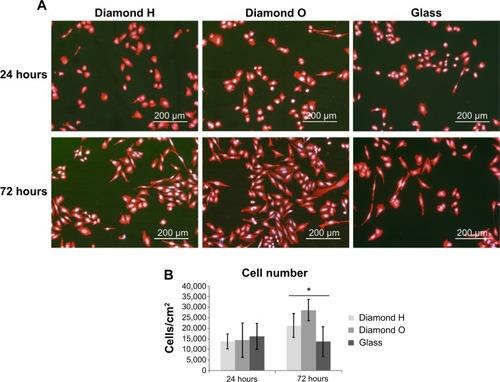
Figure 4 Appearance of the cell layers on NCD films.
Notes: LIVE/DEAD staining (A–C) and immunofluorescence staining of type I collagen (D–F) in Saos-2 cells after 2-week culture in the medium with added AA on H-terminated NCD films (A and D); on O-terminated NCD films (B and E); and on glass (C and F). Seeding density was 25×103 cells/cm2; differentiation occurred after confluence. Fluorescence microscopy (Olympus IX 51) (A–C). Confocal microscopy (Leica TCS SPE), maximum projection (D–F).
Abbreviations: NCD, nanocrystalline diamond; AA, ascorbic acid.
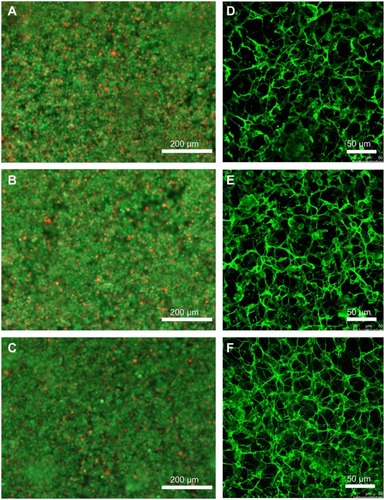
Figure 5 SHG imaging showing collagen fibers in the cell layers on NCD films.
Notes: SHG signal (magenta), type I collagen immunofluorescence staining (green), and cell autofluorescence (blue) of Saos-2 cells after 2-week culture in the medium with added AA on H-terminated NCD films, on O-terminated NCD films, and on glass. The bar represents 40 μm (A). The area producing an SHG signal and green fluorescence was assessed by image analysis of 25 images in each group. Seeding density was 25×103 cells/cm2; differentiation occurred after confluence. Confocal microscopy (Leica SP2). Data are expressed as the mean ± SD (B).
Abbreviations: SHG, second harmonic generation; NCD, nanocrystalline diamond; AA, ascorbic acid; SD, standard deviation.
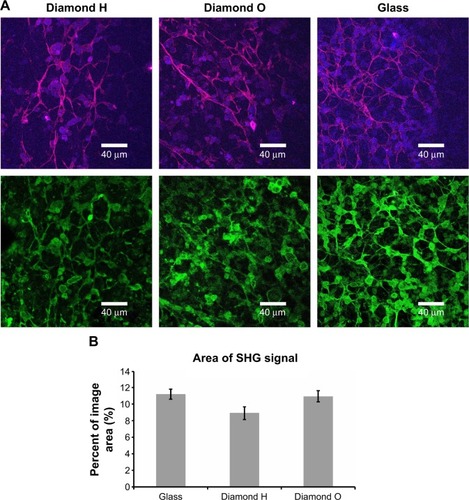
Figure 6 Collagen content and ALP activity in the cell layers on NCD films.
Notes: (A, B) Saos-2 cells after 2-week culture in the medium with added AA on H-terminated NCD films (Diamond H), on O-terminated NCD films (Diamond O), and on PS. Seeding density was 25×103 cells/cm2, differentiation after confluence. The collagen content and ALP activity were normalized by the substrate area; the ALP activity was expressed as a percentage of the control (PS=100%). Data are expressed as the mean ± SD. *Statistically significant at P≤0.05.
Abbreviations: PS, cell culture polystyrene dishes; ALP, alkaline phosphatase; NCD, nanocrystalline diamond; AA, ascorbic acid; SD, standard deviation.
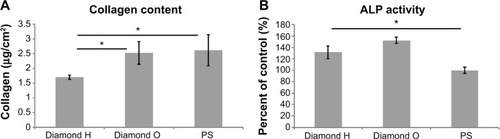
Figure 7 Calcium deposition and DNA content in the cell layers on NCD films.
Notes: (A, B) Saos-2 cells after 2-week culture in the growth medium (No AA) or with added AA (+AA) on H-terminated NCD films (Diamond H), on O-terminated NCD films (Diamond O), and on PS. Seeding density was 25×103 cells/cm2, differentiation occurred after confluence. The calcium content and DNA content were normalized by the substrate area. Data are expressed as the mean ± SD. *Statistical significance at P≤0.05.
Abbreviations: PS, cell culture polystyrene dishes; AA, ascorbic acid; NCD, nanocrystalline diamond; SD, standard deviation.
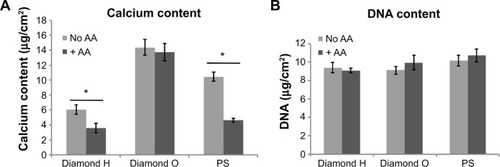
Figure 8 Expression of the bone-specific genes.
Notes: (A–C) Gene expression of the osteogenic markers ALP, collagen I, and osteocalcin determined by real-time PCR in Saos-2 cells after 2-week culture in the growth medium (no AA) or with added AA (+ AA) on H-terminated NCD films (diamond H), on O-terminated NCD films (diamond O), and on PS. Seeding density was 25×103 cells/cm2, differentiation occurred after confluence. The relative fold expression was related to the control cells grown on PS at day 0 of differentiation and was normalized by GAPDH expression. The numbers above the columns mark statistically significant (P≤0.05) difference compared to the group labelled with the same number at the base of the column.
Abbreviations: ALP, alkaline phosphatase; PS, cell culture polystyrene dishes; AA, ascorbic acid; collagen I, type I collagen; PCR, polymerase chain reaction; NCD, nanocrystalline diamond; GAPDH, glyceraldehyde 3-phosphate dehydrogenase.
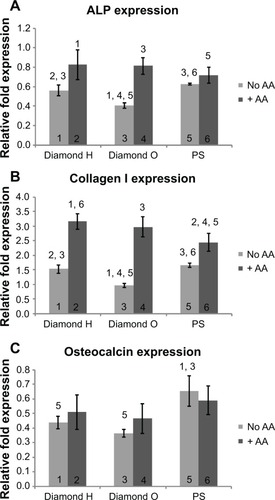
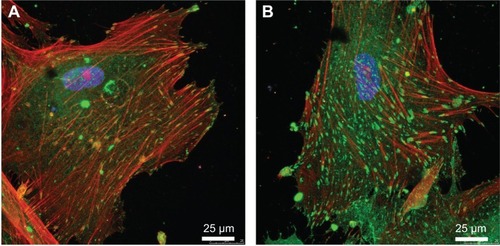
Figure 9 The adhesion of primary human osteoblasts on H-terminated NCD films and O-terminated NCD films.
Notes: Primary human osteoblasts cultivated on H-terminated NCD films (A) and on O-terminated NCD films (B) for 7 days. The cells were stained for talin (green; immunofluorescence), actin (red; phalloidin/TRITC), and DNA (blue; DAPI). Similar results have been published.Citation45
Abbreviations: NCD, nanocrystalline diamond; TRITC, tetramethylrhodamine; DAPI, 4′,6-diamidino-2-phenylindole.