Figures & data
Figure 1 WOx deposited by PLD onto carbon paper substrate.
Notes: (A and B) FESEM images. (C) Micro-Raman spectrum. (D) High-resolution XPS spectrum of the W 4f region.
Abbreviations: FESEM, field emission scanning electron microscopy; PLD, pulsed laser deposition; WOx, tungsten oxide; XPS, X-ray photoelectron spectroscopy.
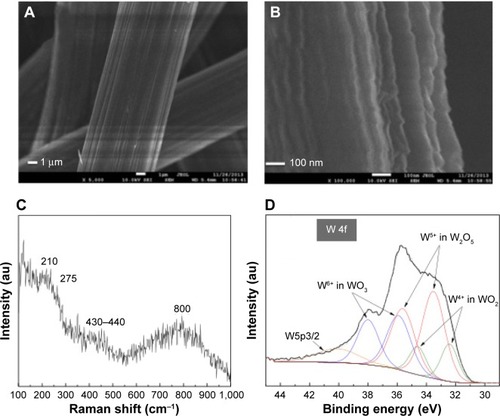
Figure 2 WOx deposited by PLD onto carbon paper substrate.
Notes: (A and B) TEM and (C and E) HR-TEM analyses. (D) SAED pattern.
Abbreviations: SAED, selected-area electron diffraction; HR-TEM, high-resolution transmission electron microscopy; PLD, pulsed laser deposition; TEM, transmission electron microscopy; WOx, tungsten oxide.
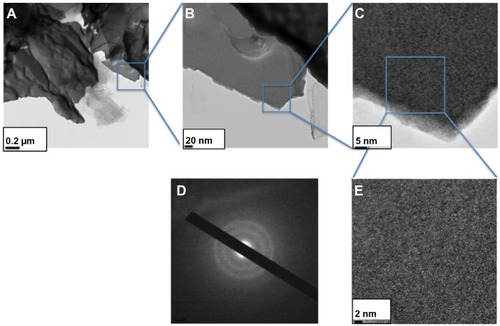
Figure 3 FESEM images at increasing magnification of Au deposited by PLD with 50,000 laser pulses onto WOx.
Notes: The images are taken at different magnifications as shown by the scale bars (A–D), from the same location.
Abbreviations: FESEM, field emission scanning electron microscopy; PLD, pulsed laser deposition; WOx, tungsten oxide.
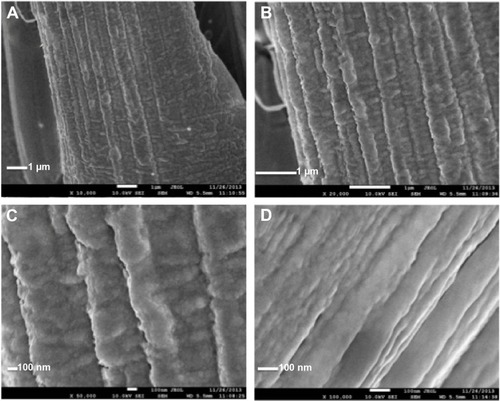
Figure 4 Surface analyses of Au deposited by PLD onto WOx.
Notes: (A) XRD and (B) high-resolution XPS spectrum of the Au 4f region of PLD deposited Au with 50,000 laser pulses onto WOx.
Abbreviations: PLD, pulsed laser deposition; WOx, tungsten oxide; XPS, X-ray photoelectron spectroscopy; XRD, X-ray diffraction.
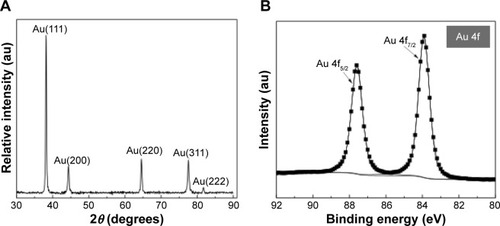
Figure 5 Analyses of Au deposited by PLD.
Notes: (A and B) TEM and (C) HR-TEM analyses of Au deposited by PLD. (D) Particle size distribution.
Abbreviations: HR-TEM, high-resolution transmission electron microscopy; PLD, pulsed laser deposition; TEM, transmission electron microscopy.
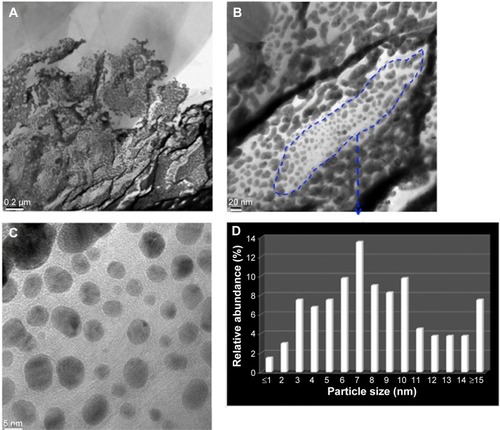
Figure 6 Cyclic voltammetry at Au deposited onto WOx.
Notes: (A) Recorded with 50 mV second−1 potential scan rate in a deaerated solution of 0.5 M H2SO4. (B) Recorded with 2 mV second−1 potential scan rate in argon-saturated 0.01 M phosphate-buffered saline solution at pH 7.2 containing 100 mM of glucose.
Abbreviation: WOx, tungsten oxide.
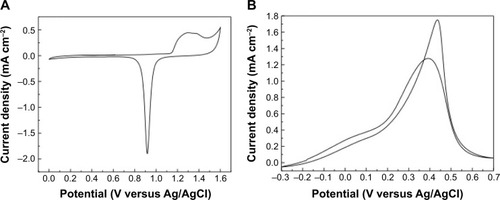
Figure 7 Electrochemical studies of glucose detection and sensitivity.
Notes: (A) Square-wave voltammograms recorded with an amplitude of 20 mV, a step potential of 1 mV, and a frequency of 20 Hz at the WOx/Au electrode in argon-saturated 0.01 M phosphate-buffered saline solution at pH 7.2 containing concentrations of glucose varying from 0.1 mM to 100 mM. (B) The dependence of the peak current of the glucose oxidation on the concentration of glucose. (C) The obtained linearity domain up to 10 mM of glucose.
Abbreviation: WOx, tungsten oxide.
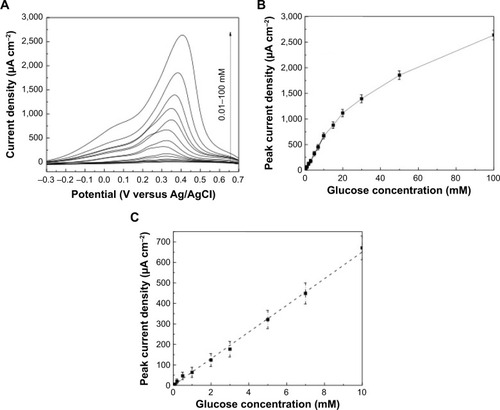
Figure S1 XPS survey scan of WOx deposited onto carbon paper.
Abbreviations: XPS, X-ray photoelectron spectroscopy; WOx, tungsten oxide.
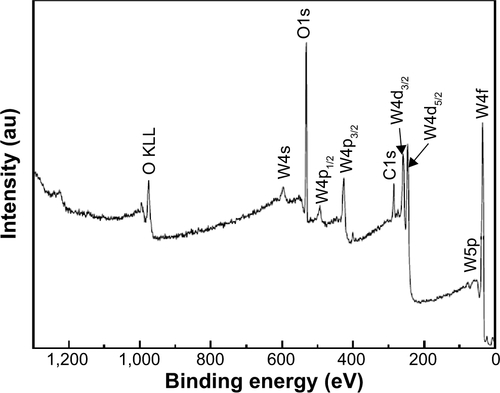
Figure S2 XPS survey scan of Au deposited onto WOx.
Abbreviations: WOx, tungsten oxide; XPS, X-ray photoelectron spectroscopy.
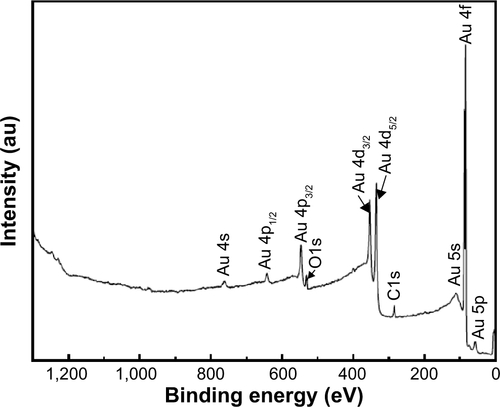
Figure S3 Electrochemical studies of glucose detection and sensitivity.
Notes: (A) Voltammetry measurements recorded with 2 mV second−1 at the Au-WOx electrode in argon-saturated 0.01 M PBS solution at pH 7.2 containing concentrations of glucose varying from 0.01 mM to 100 mM; (B) the dependence of the peak current density over the whole range of glucose concentration and (C) the linearity domain of peak current density. A linear relationship with a regression equation of y = 30.8 × + 0.34 (×: concentration/mM, y: current/μA cm−2) and a correlation coefficient of R2 = 0.9987 was observed from 10 μM to 15 mM (C). The sensitivity was found to be 30.8 μA cm−2 mM−1 and a low detection limit 10 μM.
Abbreviations: WOx, tungsten oxide; PBS, phosphate-buffered saline.
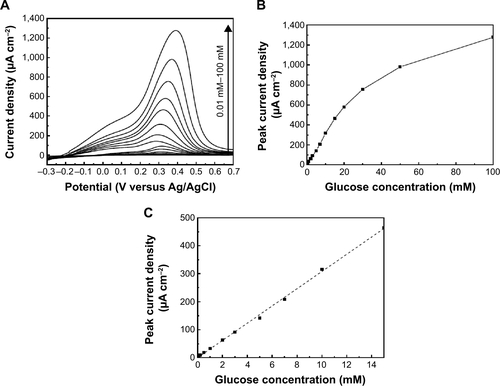
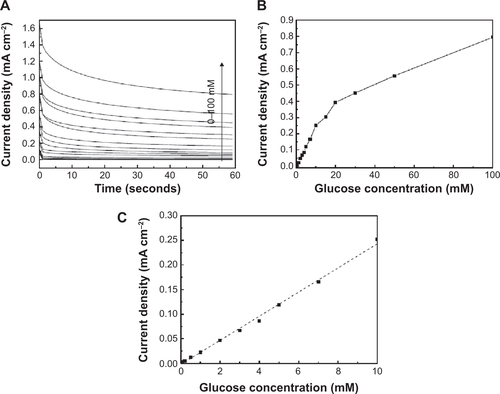
Figure S4 Electrochemical studies of glucose detection and sensitivity.
Notes: (A) Chronoamperometry measurements at an applied potential of 0.25 V vs Ag/AgCl at the Au-WOx electrode in argon-saturated 0.01 M PBS solution at pH 7.2 containing concentrations of glucose varying from 0 mM to 100 mM; (B) the dependence of the steady-state current density over the whole range of glucose concentration and (C) the linearity domain of the steady-state current density. A linear relationship with a regression equation of y = 24.5 ×−2.1 (×: concentration/mM, y: current/μA cm−2) and a correlation coefficient of R2 = 0.9961 was observed from 10 μM to 10 mM (C). The sensitivity was found to be 24.5 μA cm−2 mM−1 and a low detection limit 10 μM.
Abbreviations: WOx, tungsten oxide; PBS, phosphate-buffered saline.