Figures & data
Figure 1 Schematic illustration of (A) the core–shell structure of MH-PNs and MH-MNs, and (B) accumulation of nanoparticles in tumor sites through the EPR effect, intracellular trafficking pathway, and synergistic antitumor effect of MH and TPGS.
Notes: Chemical structures of HA-PBCA (a), MH (b), and TPGS (c). The intracellular trafficking pathway includes steps of receptor-meditated cellular internalization, endolysosomal disassembly, and drug release.
Abbreviations: EPR, enhanced permeability and retention; HA-PBCA, hyaluronic acid-poly(butyl cyanoacrylate); IV, intravenous; MH, morin hydrate; MH-MNs, morin hydrate-loaded mixed nanoparticles; MH-PNs, morin hydrate-loaded plain nanoparticles; ROS, reactive oxygen species; TPGS, D-alpha-tocopheryl polyethylene glycol 1000 succinate.
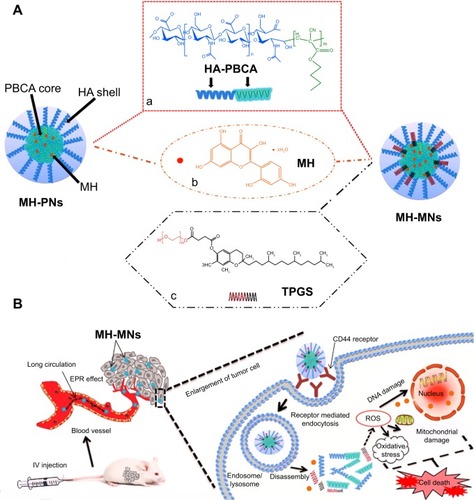
Figure 2 Effect of HA/BCA molar ratio on particle size.
Notes: HA-PBCA nanoparticles were prepared by radical emulsion polymerization from low molecular weight HA at a constant concentration of cerium ammonium nitrate (0.8 mmol/L) and 1 hour reaction time. Variation of nanoparticles diameter was evaluated as a function of HA/BCA molar ratio. Error bars refer to standard deviations, n=3.
Abbreviations: HA, hyaluronic acid; BCA, butyl cyanoacrylate; HA-PBCA, hyaluronic acid-poly(butyl cyanoacrylate).
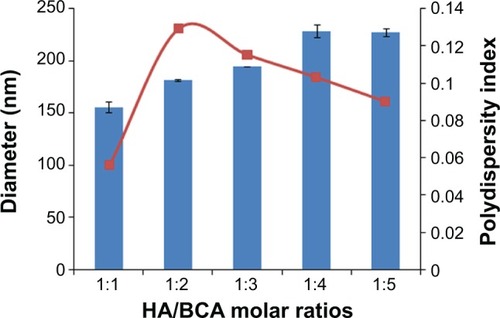
Figure 3 Plot of the intensity ratio (1338 nm/I333 nm) from pyrene emission spectra versus the logarithm of the concentration (Log C) of (A) HA-PBCA and (B) HA-PBCA/TPGS at pH 7.4.
Notes: The CAC value was determined as the point of intersection of two tangents drawn to the curve at high and low concentrations, respectively.
Abbreviations: CAC, critical aggregation concentration; HA-PBCA, hyaluronic acid-poly (butyl cyanoacrylate); TPGS, D-alpha-tocopheryl polyethylene glycol 1000 succinate.
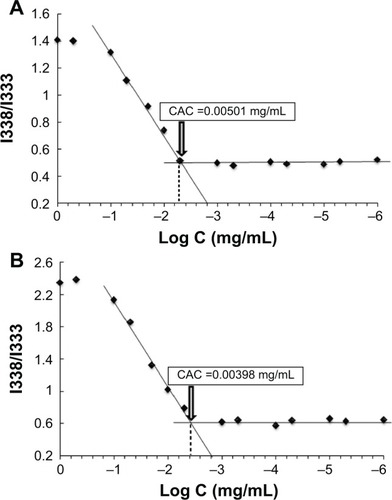
Table 1 Physical characterization of polymeric nanoparticles in PBS pH 7.4
Figure 4 (A) Particle size distribution and (B) morphological characteristics of MH-PNs and MH-MNs, as determined by DLS and TEM, respectively. (C) DSC thermogram of (a) MH, (b) physical mixture of MH and HA-PBCA, (c) blank PNs, (d) MH-PNs, (e) physical mixture of MH, HA-PBCA and TPGS, (f) blank MNs, and (g) MH-MNs.
Abbreviations: DLS, dynamic light scattering; DSC, differential scanning calorimetry; HA-PBCA, hyaluronic acid-poly(butyl cyanoacrylate); MH-MNs, morin hydrate-loaded mixed nanoparticles; MH-PNs, morin hydrate-loaded plain nanoparticles; TEM, transmission electron microscopy; TPGS, D-alpha-tocopheryl polyethylene glycol 1000 succinate.
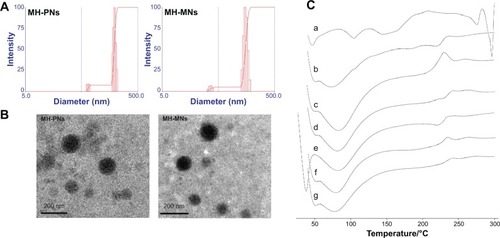
Figure 5 In vitro cytotoxicity studies.
Notes: In vitro cytotoxicity of blank PNs and blank MNs determined by MTT assay in (A) A549 cells and (B) L02 cells. A549 and L02 cells were incubated with different concentrations of blank nanoparticles for 72 hours. *P<0.05; ***P<0.001. (C) Cytotoxicity of free MH, MH-PNs, and MH-MNs determined by PI assay in A549 cells. Cell death was evaluated by PI assay as a function of MH concentration for 72 hours. *P<0.05 versus MH group and #P<0.05 versus MH-PNs group. Data represent mean ± SD (n=5).
Abbreviations: A549, human lung adenocarcinoma cell line; L02, human hepatic cell line; MH, morin hydrate; MH-MNs, morin hydrate-loaded mixed nanoparticles; MH-PNs, morin hydrate-loaded plain nanoparticles; MNs, mixed nanoparticles; MTT, 3-[4,5-dimethylthiazol-2-yl]-2,5-diphenyl-tetrazolium bromide; PI, propidium iodine; PNs, plain nanoparticles; SD, standard deviation.
![Figure 5 In vitro cytotoxicity studies.Notes: In vitro cytotoxicity of blank PNs and blank MNs determined by MTT assay in (A) A549 cells and (B) L02 cells. A549 and L02 cells were incubated with different concentrations of blank nanoparticles for 72 hours. *P<0.05; ***P<0.001. (C) Cytotoxicity of free MH, MH-PNs, and MH-MNs determined by PI assay in A549 cells. Cell death was evaluated by PI assay as a function of MH concentration for 72 hours. *P<0.05 versus MH group and #P<0.05 versus MH-PNs group. Data represent mean ± SD (n=5).Abbreviations: A549, human lung adenocarcinoma cell line; L02, human hepatic cell line; MH, morin hydrate; MH-MNs, morin hydrate-loaded mixed nanoparticles; MH-PNs, morin hydrate-loaded plain nanoparticles; MNs, mixed nanoparticles; MTT, 3-[4,5-dimethylthiazol-2-yl]-2,5-diphenyl-tetrazolium bromide; PI, propidium iodine; PNs, plain nanoparticles; SD, standard deviation.](/cms/asset/4821d235-d0e6-448f-9d3c-478d45271379/dijn_a_73971_f0005_c.jpg)
Figure 6 In vitro evaluation of cellular internalization.
Notes: (A) Cellular uptake of free C6, C6-PNs, and C6-MNs with and without pretreatment with free HA polymer, in A549 as a function of the incubation time (2 and 4 hours at 37°C). (B) Confocal microscopic images of A549 cells after incubation with free C6, C6-PNs, and C6-MNs for 2 and 4 hours. (C) Quantitative flow cytometric analysis of the intracellular uptake of C6, C6-PNs, and C6-MNs with and without pretreatment with free HA polymer in A549 cells for 2, 4, and 6 hours of incubation. **,##,××P<0.01. (D) Flow cytometric curves of C6, C6-PNs, and C6-MNs with and without pretreatment with free HA polymer after 4 hours of incubation in A549 cells. Each analysis was generated by counting 104 cells. Results are expressed as the mean ± SD.
Abbreviations: C6, coumarin-6; C6-MNs, coumarin-6-loaded mixed nanoparticles; C6-PNs, coumarin-6-loaded plain nanoparticles; HA, hyaluronic acid; SD, standard deviation.
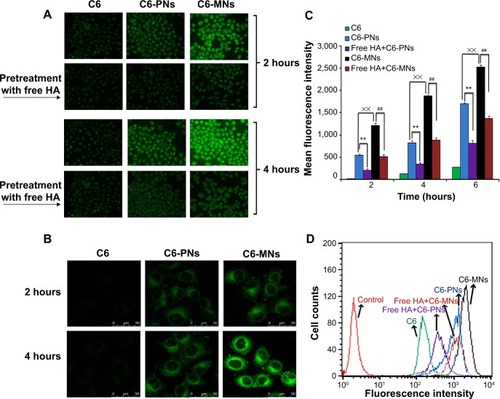
Figure 7 Effect of endocytic inhibitors on the internalization of C6-PNs and C6-MNs in A549 cells (n=3).
Notes: A549 cells were pretreated with 0.45 M sucrose, 15 μg/mL nystatin, 50 μM amiloride, and 10 mg/mL HA for 1 hour and then, treated with C6-PNs and C6-MNs for 2 hours at 37°C. A549 cells incubated with C6-PNs and C6-MNs without inhibitors were used as controls. The fluorescence intensity of each group was evaluated by FCM.
Abbreviations: C6-MNs, coumarin-6 loaded mixed nanoparticles; C6-PNs, coumarin-6 loaded plain nanoparticles; FCM, flow cytometry; HA, hyaluronic acid.
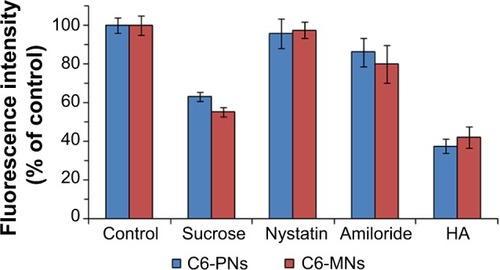
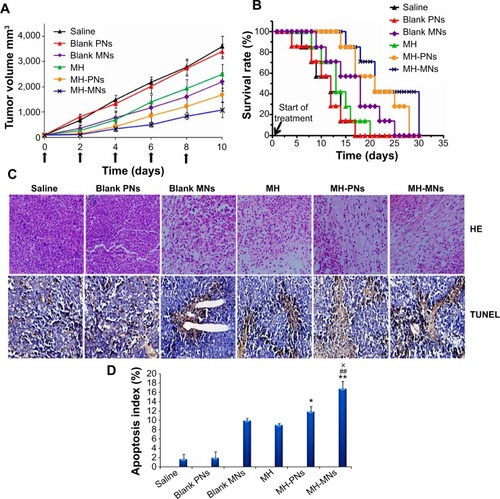
Figure 8 In vivo antitumor efficacy in S180 tumor-bearing nude mice.
Notes: (A) Tumor volume changes as a function of time after intravenous injection of saline, blank PNs, blank MNs, free MH, MH-PNs, and MH-MNs. The concentration of blank nanoparticles used was equal to the concentration of MH-loaded nanoparticles. Throughout the study, tumors were measured using a digital caliper, and tumor volumes were calculated from the formula: V =1/2 (length × widthCitation2). The arrows signify the time of intravenous administration. Data are expressed as mean ± SD (n=7). (B) Kaplan–Meier survival curves of tumor-bearing mice. The survival of mice was recorded since the first day of injection. (C) Representative images of tumor sections separated from mice after HE and TUNEL staining. (D) The apoptosis index is shown as a percentage of TUNEL-positive cells. *P<0.05 and **P<0.01 versus MH group, ##P<0.01 versus blank MNs group, ×P<0.05 versus MH-PNs.
Abbreviations: HE, hematoxylin and eosin; MH, morin hydrate; MH-MNs, morin hydrate-loaded mixed nanoparticles; MH-PNs, morin hydrate-loaded plain nanoparticles; MNs, mixed nanoparticles; PNs, plain nanoparticles; SD, standard deviation; TUNEL, terminal deoxynucleotidyl transferase dUTP nick end labeling.