Figures & data
Table 1 Weight ratios of Cremophor® RH40, Labrasol® and Transcutol® HP and the corresponding pseudoternary phase diagram numberings
Figure 1 Pseudoternary phase diagram of the different Smix systems containing the oil phase (Labrafil®), surfactants (Labrasol® and Cremophor® RH40), cosurfactant (Transcutol® HP), and aqueous phase (distilled water).
Note: The gray areas represent the microemulsion regions.
Abbreviations: Km, weight ratio between surfactants and cosurfactant; Ks, weight ratio between two surfactants ie. Cremophor RH40 and Labrasol; Smix, mixture of Cremophor RH40 Labrofil and Transcutol HP.
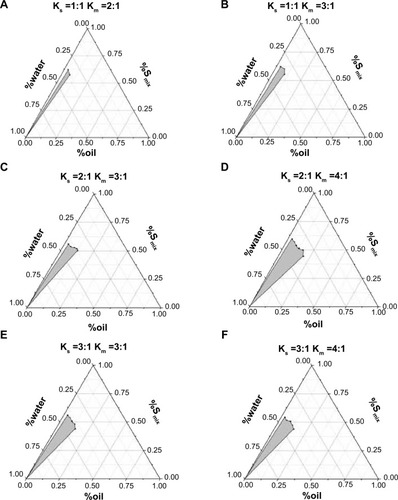
Table 2 Variables and observed responses in the CCD for the microemulsion
Table 3 Solubility of rotigotine in various solvents
Table 4 Analysis of variance for the responses Y1 and Y2 after fitting by the quadratic model
Figure 2 Linear correlation plots (A and B) between the actual and predicted values.
Abbreviations: Jss, steady-state flux; Q24, permeation of rotigotine in 24 hours.
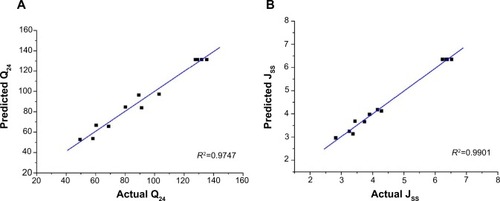
Figure 3 The contour plot (A and B) and corresponding surface response plots (C and D).
Abbreviations: Jss, steady-state flux; Q24, permeation of rotigotine in 24 hours; Smix, mixture of Cremophor RH40, Labrofil and Transcutol HP.
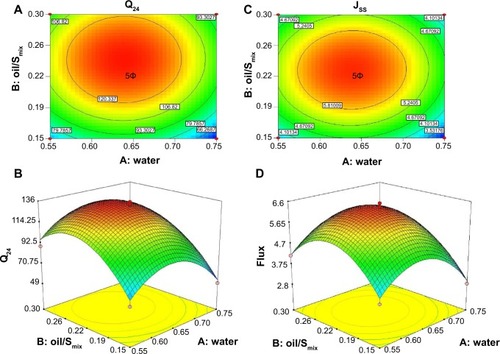
Table 5 The predicted and experimental values of the response variables and predicted error percentages
Figure 4 In vitro permeation profiles of rotigotine in the microemulsions and oil (Labrafil®).
Note: Each point represents the mean ± SD (n=3).
Abbreviations: ME, microemulsion formulation; SD, standard deviation.
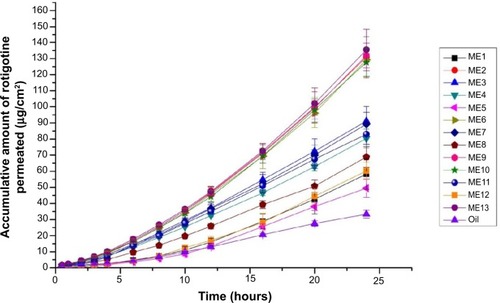
Figure 5 Transmission electron microscopy of the rotigotine-loaded microemulsion.
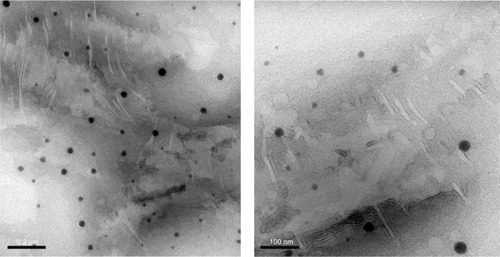
Figure 6 Accumulated amount of rotigotine that permeated from the optimal formulation of the rotigotine microemulsion gels at different Carbomer concentrations (w/w).
Note: The values represent the mean ± SD (n=3).
Abbreviations: ME, microemulsion formulation; SD, standard deviation.
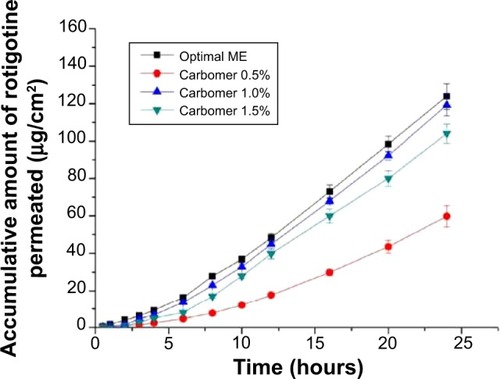
Table 6 Pharmacokinetic parameters of the rotigotine microemulsion gel and Neupro® patch
Figure 7 Drug–time curves in rats administered the rotigotine microemulsion gel and Neupro® patch.
Note: Each point represents the mean ± SD (n=6).
Abbreviation: SD, standard deviation.
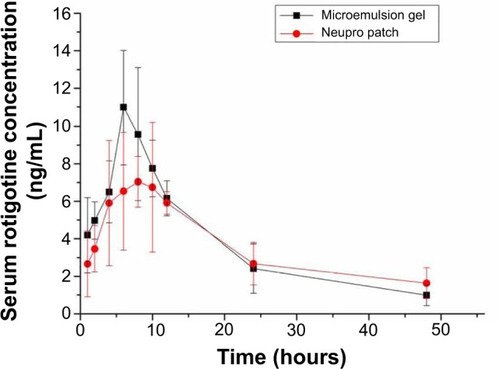
Table 7 The average skin irritation response scores
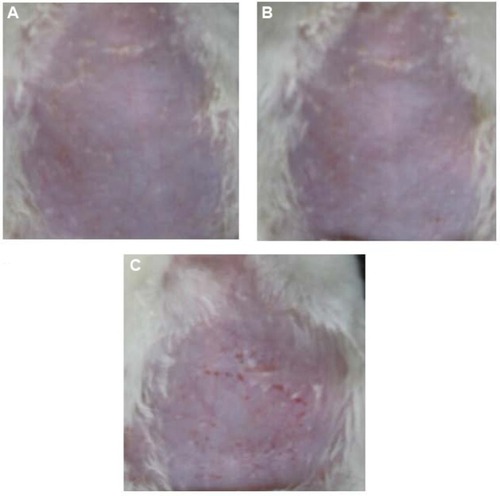
Figure 8 Skin irritancy studies on rat abdomens.
Notes: (A) No drug. (B) Rotigotine microemulsion gel administration. (C) Neupro® patch administration.