
Figures & data
Figure 1 Uptake of NPs by C2C12 myoblasts.
Notes: (A) Z-projection of confocal images and xz and yz-slices (orthogonal views along white lines) of NPs interacting with cells for 1 hour. Blue, Hoescht-stained nuclei; red, TRITC-phalloidin-stained actin filaments; green, fluorescein isothiocyanate-labeled NPs. White arrow marks fluorescent spot inside the cell. Scale bar, 10 μm. (B–F) Transmission electron microscopy images of NPs interacting at cell surface (B) and NPs within cytoplasm (C–F). Insets are enlarged areas marked with black squares in (B–F). Black arrows indicate plasma membrane surrounding NP. Asterisk marks the cell side facing the support. Scale bars, 10 μm (A), 1 μm (B–F), and 100 nm (insets).
Abbreviations: NP, silica nanoparticle; TRITC, tetramethylrhodamine B isothiocyanate.
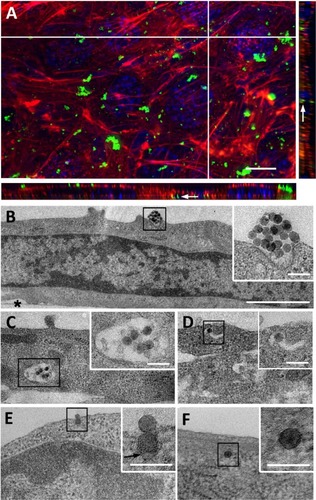
Figure 2 Effect of endocytosis inhibitors on cellular uptake of NPs.
Notes: Cells were pretreated at 37°C with chlorpromazine (CP), genistein (G), cytochalasin D (cyto D), sodium azide, and 2-deoxy-D-glucose (deoxy) for 30 minutes and then exposed to NPs (3 μg/cm2) and inhibitors for 30 minutes. Cells maintained at 4°C were exposed to NPs for 30 minutes after 30 minutes of preincubation at 4°C. Quantification of internalization was performed by flow cytometry, after addition of trypan blue. (A) Flow cytometry analysis of FITC-NPs uptake by treated cells. (B) Percentage of uptake relative to untreated cells exposed to NPs. This was calculated by dividing the mean cell fluorescence intensity after NP uptake in drug-treated cells by that of untreated cells. Untreated cells at 37°C ± standard error of the mean. Bars on the graph represent the standard of the mean. *Significantly different from the control (P≤0.05); n=3.
Abbreviation: NP, silica nanoparticle.
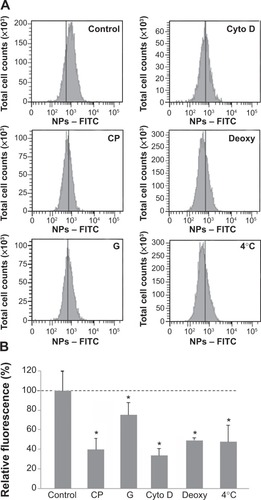
Figure 3 Fate of NP uptake by myoblasts after 4 hours.
Notes: Transmission electron microscopy images of a large amount of NPs accumulated in vesicles (A) or in organelles undergoing degradation (B). Few NPs in vesicle (C) and isolated NP in cytoplasm (D) were visible, as observed after 1 hour of exposure. Insets are enlarged areas marked with black squares. Asterisk marks the cell side facing the support. Scale bars, 1 μm (A–D) and 100 nm (insets).
Abbreviation: NP, silica nanoparticle.
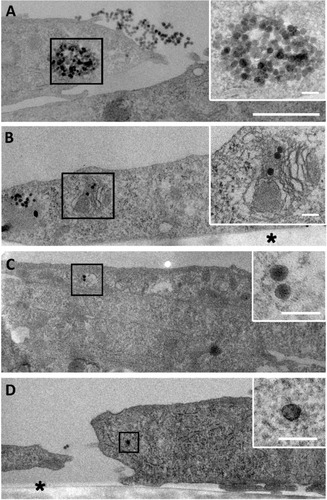
Figure 4 Long-term fate of NP uptake 7 days after initiating the differentiation process.
Notes: (A) Z-projection of confocal images and xz and yz slices (orthogonal views along white lines) of NPs within myotubes and myoblasts. Blue, Hoescht-stained nuclei; red, TRITC-phalloidin-stained actin filaments; green, fluorescein isothiocyanate-labeled NPs. Scale bar, 10 μm. (B) Three-dimensional view of the field shown in A. (C) TEM images of NPs accumulated in myoblasts. Typical vesicles containing NPs (1–3) are enlarged areas marked with black squares in C. (D) TEM images of NPs accumulated in polynucleated myotube. 1–3 are enlarged areas (marked with black squares in D) of typical vesicles containing NPs similar to those in C. Image 4 shows typical sarcomeric structures and numerous mitochondria characteristic of myotubes. Asterisks mark the cell side facing the support. Scale bars, 1 μm (C, D) and 100 nm (enlarged images).
Abbreviations: NP, silica nanoparticle; TEM, transmission electron microscopy.
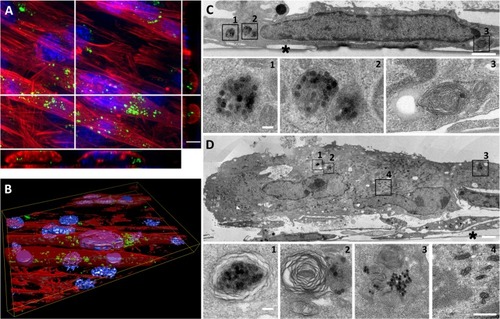
Figure 5 Effect of NPs on the expression of muscle specific markers in myotubes.
Notes: (A) Fluorescence images of myotubes after incubation with and without NPs. Red, staining of alpha-actinin characteristic of the sarcomeric organization of myofibers; blue, Hoechst stained-nuclei. Scale bar, 1 μm. (B) Expression of muscle-specific markers. After myoblast treatment with NPs, proteins were extracted from myotubes at day 7 of differentiation and subjected to sodium dodecyl sulfate polyacrylamide gel electrophoresis. Immunodetection was carried out using specific antibodies against alpha-actinin, myosin heavy chain, and myogenin. Glyceraldehyde-3-phosphate dehydrogenase was used as a loading control. (C) The level of the different proteins was quantified and expressed as a percentage of the level obtained in the untreated control cells. Bars on the graph represent the standard error of the mean. *Significantly different from the control (P≤0.05).
Abbreviation: NP, silica nanoparticle.
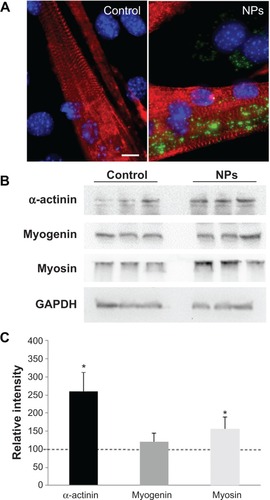
Figure 6 Myotube formation promoted by NP uptake.
Notes: Myotube fusion was analyzed at days 2, 3, and 4 of differentiation when myoblasts were incubated or not (control) with NPs. (A) Fluorescent images of myoblasts and nascent myotubes at days 2 and 4 of differentiation. Myotubes arising from NP-treated myoblasts appeared larger. Nuclei (Hoechst, blue) and myotubes (anti-myosin antibody, red) were labeled. Scale bar, 100 μm. (B) Quantitative analysis of the fusion index. (C) Quantification of myotubes containing at least five nuclei. Their number increased significantly at the early days of differentiation. (D) Quantitative analysis of fusion index for several NP concentrations at day 3. Data are expressed as mean ± standard error of the mean; n=3. *Significantly different from the control (P≤0.05).
Abbreviation: NP, silica nanoparticle; FBS, fetal bovine serum.
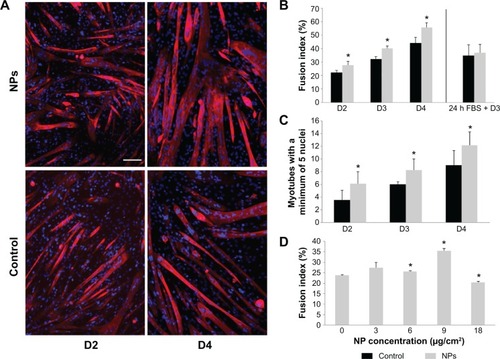
Figure 7 NP uptake enhances apoptosis required for myoblast fusion.
Notes: (A) Representative annexin V-PE/7AAD labeling pattern of myoblast populations in HS medium 24 hours (h) after NP exposure or not (control), in the absence and the presence of calcium. The population positive for annexin V and negative for 7AAD (Q4) was used to quantify PS exposure at cell surface. (B) Exposed myoblast population positive for annexin V analyzed after 6 h in HS, 24 h in HS, and 24 h in FBS, followed by 24 h in HS. (C) Percentage of cells positive for cleaved caspase-3 analyzed after 24 h in HS and 24 h in FBS, followed by 24 h in HS. Data are expressed as mean ± standard error of the mean from three independent experiments (**P<0.01).
Abbreviations: NP, silica nanoparticle; HS, horse serum; FBS, fetal bovine serum; 7AAD, 7-amino-actinomycin D; PE, phycoerythrin; PS, phosphatidylserine.
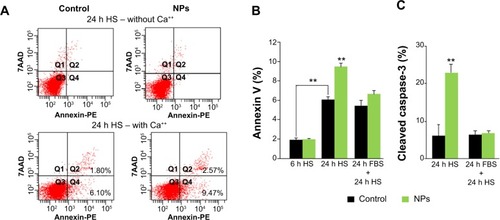
Figure S1 Cytotoxicity of NPs in C2C12 myoblasts.
Notes: Twenty-four hours after seeding at 15,000 cells/cm2, cells were exposed to various doses of NPs for 1 hour in Dulbecco’s Modified Eagle’s Medium. Cell viability was measured 16 hours after treatment, using the WST-1 assay. The toxicity threshold is observed for a NP concentration of 9 μg/cm2. Data are the percentages of surviving cells relative to the control reported as the mean ± standard error of the mean of three independent experiments.
Abbreviation: NP, silica nanoparticle.
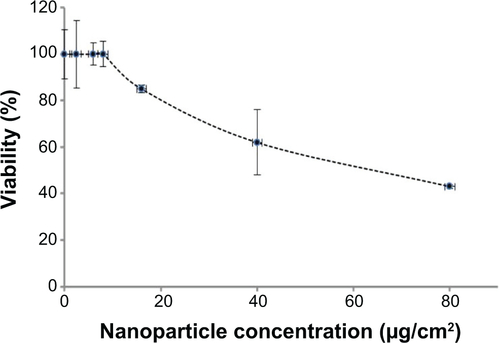
Figure S2 Transmission electron microscopy characterization of 50 nm NPs.
Notes: Transmission electron microscopy images of NPs suspended in water (40 μg/mL). Scale bar, 100 nm. A histogram showed the size distribution of 100 NPs measured using the ImageJ software. The mean diameter was 49.5±3.9 nm (standard error of the mean).
Abbreviation: NP, silica nanoparticle.
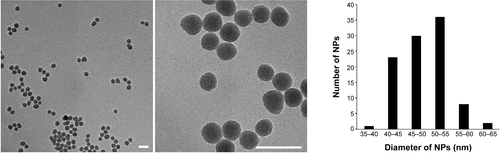
Figure S3 Dynamic light scattering curves of silica nanoparticles in water and in Dulbecco’s Modified Eagle’s Medium.
Abbreviations: DMEM, Dulbecco’s Modified Eagle’s Medium; NPs, silica nanoparticles.
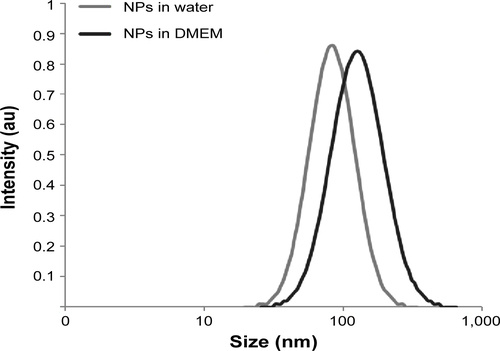
Figure S4 NP internalization as a function of cell confluence.
Notes: Cells were treated with NPs during 30 minutes at 3 μg/cm2 in Dulbecco’s Modified Eagle’s Medium, 24 hours after seeding at three concentrations: 2,000 (C1), 15,000 (C2), and 50,000 (C3) cells/cm2, corresponding to about 50%, 70%, and ~100% confluence, respectively. Quantification of NP internalization was performed by flow cytometry after the addition of Trypan blue. Results are expressed as mean cell fluorescence intensity (arbitrary unit) ± standard error of the mean; n=3.
Abbreviation: NP, silica nanoparticle.
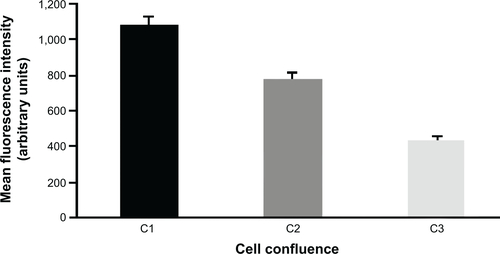
Table S1 Physicochemical characteristics of NPs