Figures & data
Figure 1 Powder X-ray diffraction patterns of the MNPs (black line A), CS-MNPs (red line B), and Strep-CS-MNPs nanocomposites (blue line C).
Abbreviations: MNPs, magnetic nanoparticles; CS-MNPs, chitosan-coated magnetic nanoparticles; Strep-CS-MNPs, streptomycin-loaded, chitosan-coated magnetic nanoparticles.
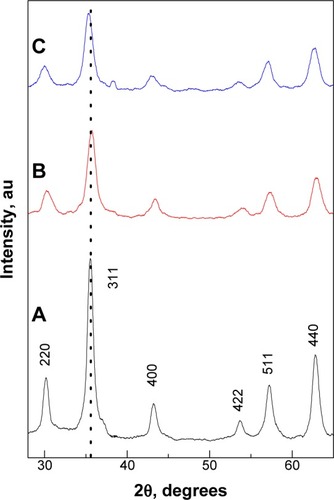
Figure 2 Effect of streptomycin-loaded, chitosan-coated magnetic nanoparticles (Strep-CS-MNPs) on the inhibition of microbial growth using the plate colony-counting method at two concentrations: (A) 1 mg and (B) 2 mg.
Notes: The data display the mean of the MIC ± SEM. Each time point represents the mean growth rate inhibition ± SEM. Asterisks indicate growth inhibition values of components that are significantly different from the growth rate inhibition values of Strep-CS-MNPs derived by using statistical analysis of two-way ANOVA, as follows: ****P<0.0001; ***P<0.001; **P<0.01.
Abbreviations: CFU, colony-forming unit; SA, Staphylococcus aureus; PA, Pseudomonas aeruginosa; EC, Escherichia coli; CA, Candida albicans; MIC, minimum inhibitory concentration; SEM, standard error of the mean; ANOVA, analysis of variance.
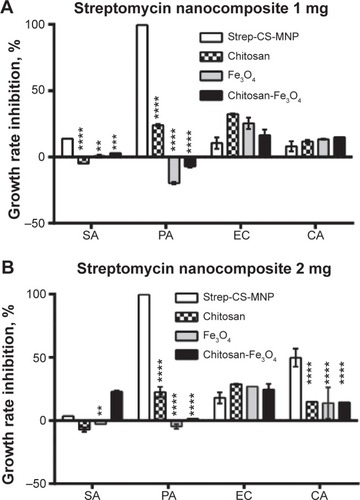
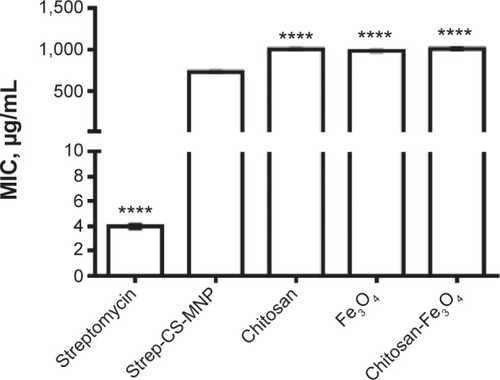
Figure 3 Minimum inhibitory concentrations (MICs; μg/mL) of streptomycin-loaded, chitosan-coated magnetic nanoparticles (Strep-CS-MNPs), as compared to components against Mycobacterium tuberculosis, as determined by the Mycobacteria Growth Indicator Tube (MGIT™) with BACTEC™ MGIT 960 growth supplement for drug susceptibility testing (DST), and measured by the MGIT 960 instrument (BD, Franklin Lakes, NJ, USA).
Notes: The data display the mean of the MIC ± SEM. The statistical significance was calculated using a one-way ANOVA for unpaired values between Strep-CS-MNPs and components, with the significance level indicated by asterisks (****P<0.0001).
Abbreviations: SEM, standard error of the mean; ANOVA, analysis of variance.