
Figures & data
Figure 1 Sketch map of the loading of bioactive molecules on alkali-treated Ti.
Abbreviations: Alkali-treated Ti, alkali-treated titanium substrate; DPBS, Dulbecco’s phosphate-buffered saline.
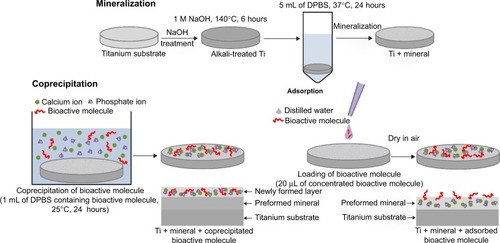
Table 1 Descriptions of samples and the amount of bioactive molecules loaded on each sample
Figure 2 Scanning electron microscope images of representative samples.
Notes: Samples from each of the following groups were examined: alkali-treated titanium substrate (A), 24-hour mineralization (B); 24-hour mineralization, 24-hour coprecipitation of mineral and OGP (C); 24-hour mineralization, OGP adsorption (D).
Abbreviation: OGP, osteogenic growth peptide.
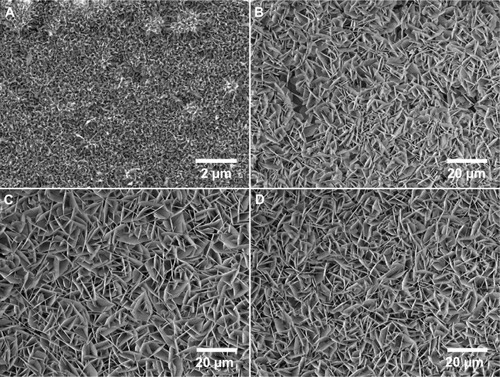
Figure 3 XRD patterns of representative samples.
Notes: Samples from each of the following groups were examined: alkali-treated titanium substrate (Alkali-treated Ti); 24-hour mineralization (Control); 24-hour mineralization, 24-hour coprecipitation of mineral and OGP (cO); 24-hour mineralization, OGP adsorption (aO).
Abbreviations: XRD, X-ray diffraction; OGP, osteogenic growth peptide; A, apatite; O, octacalcium phosphate; T, titanium.
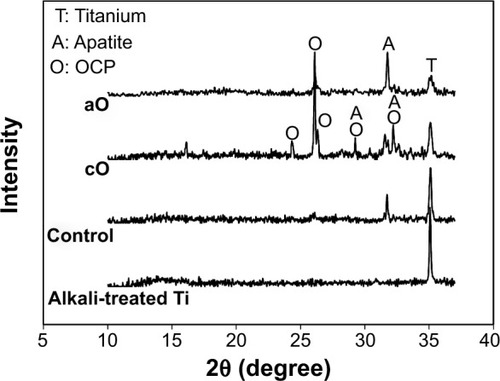
Figure 4 In vitro cumulative release of FITC-OGP in PBS over the 14-day time period.
Notes: Samples were prepared via 24-hour mineralization, 24-hour coprecipitation of mineral and FITC-OGP (cO) and 24-hour mineralization, FITC-OGP adsorption (aO). The values represent the mean ± standard deviation (n=3).
Abbreviations: FITC-OGP, fluorescein isothiocyanate-labeled OGP; OGP, osteogenic growth peptide; PBS, phosphate-buffered saline.
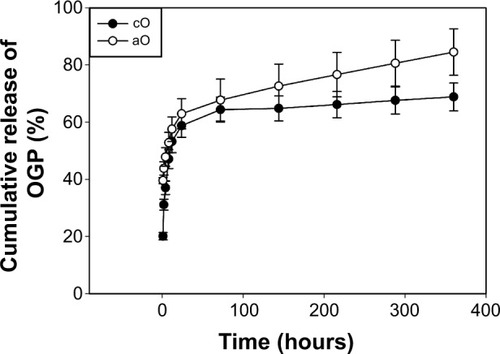
Figure 5 Total DNA quantified of rMSCs adhered to the representative samples in serum-free growth medium for 3 hours.
Notes: The samples were prepared as follows: 24-hour mineralization (Control); 24-hour mineralization, 24-hour coprecipitation of mineral and OGP (cO); 24-hour mineralization, OGP adsorption (aO); 24-hour mineralization, FN adsorption (aF); 24-hour mineralization, 24-hour coprecipitation of mineral and OGP, FN adsorption (cO/aF); 24-hour mineralization, OGP and FN adsorption (aOF). The values represent the mean ± standard deviation (n=4 or 5). In the table, pairwise comparisons of each of the groups were performed using the Student–Newman–Keuls post hoc comparison test, and significance is P<0.05.
Abbreviations: OGP, osteogenic growth peptide; FN, fibronectin; rMSCs, rat mesenchymal stem cells.
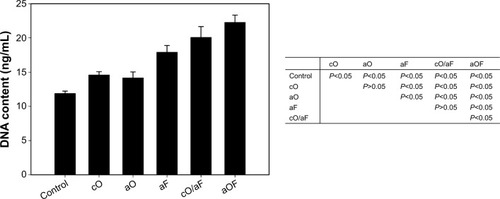
Figure 6 Confocal microscope images of rMSCs cultured on the representative samples in serum-free growth medium for 3 hours.
Notes: The samples were prepared as follows: 24-hour mineralization (Control); 24-hour mineralization, 24-hour coprecipitation of mineral and OGP (cO); 24-hour mineralization, OGP adsorption (aO); 24-hour mineralization, FN adsorption (aF); 24-hour mineralization, 24-hour coprecipitation of mineral and OGP, FN adsorption (cO/aF); 24-hour mineralization, OGP and FN adsorption (aOF). DAPI stained the nuclei (blue), and rhodamine phalloidin stained the cytoskeleton (red).
Abbreviations: DAPI, 4′,6-diamidino-2-phenylindole; OGP, osteogenic growth peptide; FN, fibronectin; rMSCs, rat mesenchymal stem cells.
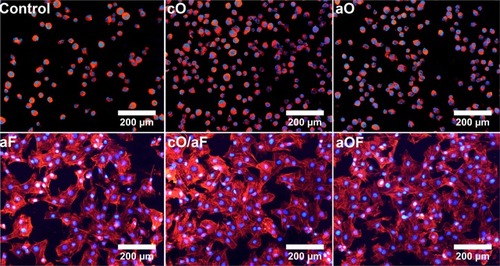
Figure 7 Cell proliferation of rMSCs cultured on the representative samples in growth medium for 1, 3, 5, and 7 days.
Notes: The samples were prepared as follows: 24-hour mineralization (Control); 24-hour mineralization, 24-hour coprecipitation of mineral and OGP (cO); 24-hour mineralization, OGP adsorption (aO); 24-hour mineralization, FN adsorption (aF); 24-hour mineralization, 24-hour coprecipitation of mineral and OGP, FN adsorption (cO/aF); 24-hour mineralization, OGP and FN adsorption (aOF). The values represent the mean ± standard deviation (n=4 or 5). In the table, pairwise comparisons of each of the groups were performed using the Student–Newman–Keuls post hoc comparison test, and significance is P<0.05.
Abbreviations: CCK-8, Cell Counting Kit-8; OGP, osteogenic growth peptide; FN, fibronectin; rMSCs, rat mesenchymal stem cells.
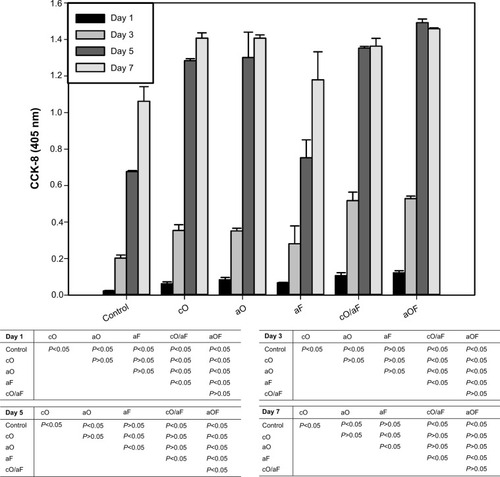
Figure 8 Normalized ALP activities with respect to total protein of rMSCs cultured on the representative samples for 3, 7, and 14 days.
Notes: rMSCs were cultured on samples in mineralizing medium as follows: 24-hour mineralization (Control); 24-hour mineralization, 24-hour coprecipitation of mineral and OGP (cO); 24-hour mineralization, OGP adsorption (aO); 24-hour mineralization, FN adsorption (aF); 24-hour mineralization, 24-hour coprecipitation of mineral and OGP, FN adsorption (cO/aF); 24-hour mineralization, OGP and FN adsorption (aOF); or rMSCs were cultured on 24-hour mineralization samples in osteogenic differentiation medium (Positive control). The values represent the mean ± standard deviation (n=4 or 5). In the table, pairwise comparisons of each of the groups were performed using the Student–Newman–Keuls post hoc comparison test, and significance is P<0.05.
Abbreviations: ALP, alkaline phosphatase; OGP, osteogenic growth peptide; FN, fibronectin; rMSCs, rat mesenchymal stem cells.
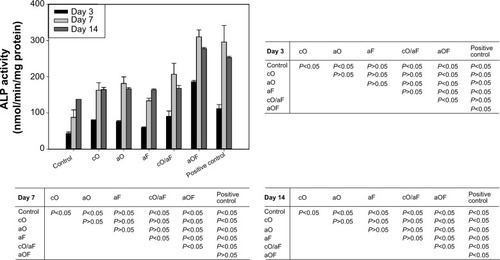
Figure 9 OC production of rMSCs cultured on the representative samples for 7, 14, and 21 days.
Notes: rMSCs were cultured on samples in mineralizing medium as follows: 24-hour mineralization (Control); 24-hour mineralization, 24-hour coprecipitation of mineral and OGP (cO); 24-hour mineralization, OGP adsorption (aO); 24-hour mineralization, FN adsorption (aF); 24-hour mineralization, 24-hour coprecipitation of mineral and OGP, FN adsorption (cO/aF); 24-hour mineralization, OGP and FN adsorption (aOF); or rMSCs were cultured on 24-hour mineralization samples in osteogenic differentiation medium (Positive control). The values represent the mean ± standard deviation (n=4 or 5). In the table, pairwise comparisons of each of the groups were performed using the Student–Newman–Keuls post hoc comparison test, and significance is P<0.05.
Abbreviations: OC, osteocalcin; OGP, osteogenic growth peptide; FN, fibronectin; rMSCs, rat mesenchymal stem cells.
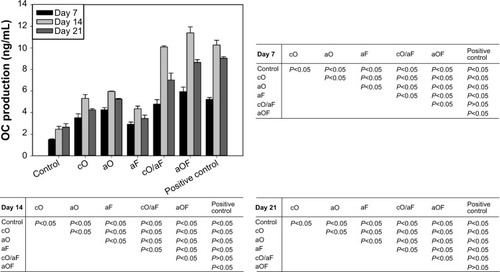
Figure 10 The calcium deposition content of rMSCs cultured on the representative samples for 28 days.
Notes: rMSCs were cultured on samples in mineralizing medium as follows: 24-hour mineralization (Control); 24-hour mineralization, 24-hour coprecipitation of mineral and OGP (cO); 24-hour mineralization, OGP adsorption (aO); 24-hour mineralization, FN adsorption (aF); 24-hour mineralization, 24-hour coprecipitation of mineral and OGP, FN adsorption (cO/aF); 24-hour mineralization, OGP and FN adsorption (aOF); or rMSCs were cultured on 24-hour mineralization samples in osteogenic differentiation medium (Positive control). The values represent the mean ± standard deviation (n=4 or 5). In the table, pairwise comparisons of each of the groups were performed using the Student–Newman–Keuls post hoc comparison test, and significance is P<0.05.
Abbreviations: OGP, osteogenic growth peptide; FN, fibronectin; rMSCs, rat mesenchymal stem cells.
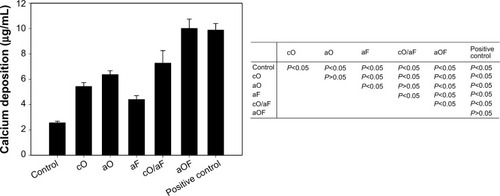
Table 2 Influences of factors on the levels of rMSC proliferation and osteogenic differentiation