Figures & data
Table 1 Levels and factors used in the applied 3Citation2 full factorial experimental design
Table 2 Formulations of topical hydrogels integrating lemongrass oil-loaded nanosponges
Table 3 In vitro evaluation of lemongrass oil-loaded nanosponges topical hydrogels
Figure 1 Response surface plot of the effect of ethyl cellulose (EC):polyvinyl alcohol (PVA) ratio (X1) and stirring rate (X2) on the particle size of the prepared nanosponges (Y1).
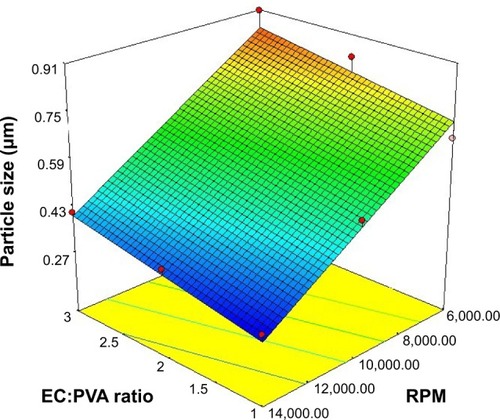
Figure 2 Morphological studies of the selected formulation F9.
Notes: (A) Scanning electron photograph of dried nanosponges (×5,000). (B) Scanning electron photograph of dried nanosponges (×35,000). (C) Transmission electron photograph of hydrogel integrating lemongrass oil-loaded nanosponges (×2,500).
Abbreviation: f, formulation.
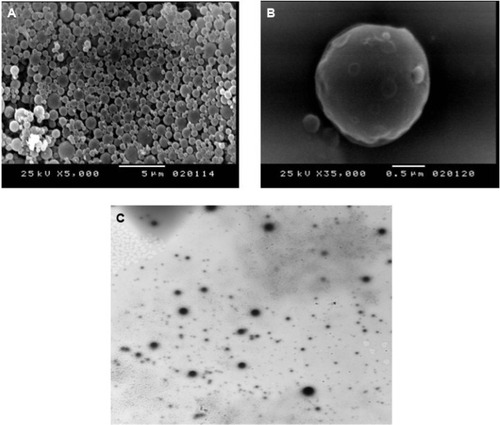
Figure 3 In vitro release profiles of lemongrass oil (LGO) from topical hydrogels integrating LGO-loaded nanosponges in phosphate buffer (pH 6.8) at 37°C±0.5°C.
Note: Results are presented as mean ± SD (n=3).
Abbreviations: f, formulation; SD, standard deviation.
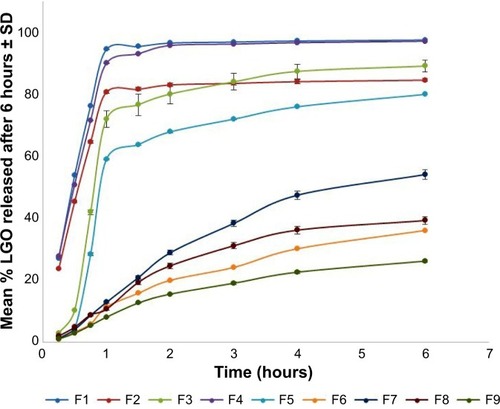
Figure 4 Response surface plot of the effect of ethyl cellulose (EC):polyvinyl alcohol ratio (PVA), (X1) and stirring rate (X2) on the mean percentage of lemongrass oil released after 6 hours (Y2).
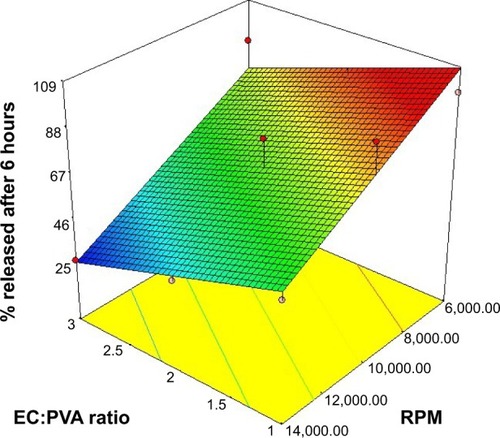
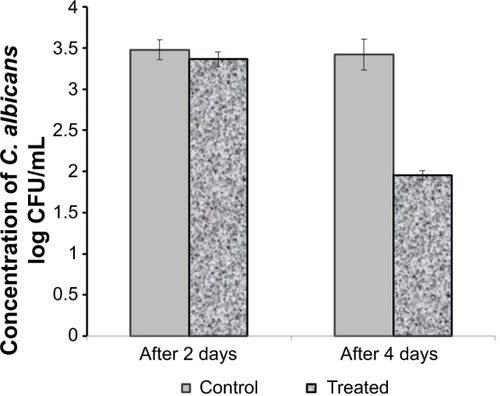
Figure 5 Antifungal activity of the selected hydrogel formulation integrating lemongrass oil-loaded nanosponges; F9 after 2 and 4 days of treatment.
Note: Values are expressed as mean ± standard deviation (n=6).
Abbreviation: f, formulation.