Figures & data
Figure 1 Study design indicating the timing of 4T1 tumor cells injection in the left inguinal mammary fat pad, the first and second iv injection of DOX or the different SWCNT conjugates, and the different BLI and MRI protocols.
Abbreviations: DOX, doxorubicin; SWCNT, single-walled carbon nanotube; BLI, bioluminescence imaging; MRI, magnetic resonance imaging; inj, injection; ADC, apparent diffusion coefficient; d, days; iv, intravenous.
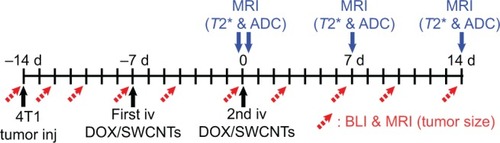
Figure 2 SWCNTs characterization.
Notes: (A) Representative TEM image of iron-tagged, CD105-conjugated, and DOX-loaded SWCNTs (SWCNT· + CD105 + DOX). TEM also allowed the detection of a thin and transparent layer of low contrast around the CNTs surface confirming the binding of PVP (dotted arrows). Chemically attached and adsorbed iron oxide nanoparticles with approximately 4–5 nm size (solid arrows) were observed on SWCNT samples using TEM, which revealed that numerous free areas were available on SWCNTs surface for further conjugation with either antibodies or drugs. (B) UV–vis spectra of oxSWCNT, SWCNT·, SWCNT· + CD105, and SWCNT· + CD105 + DOX revealing characteristic peaks at 235/256 nm for PVP polymer functionalization, at 280 nm for CD105 antibodies conjugation, and at 490 nm for DOX drugs loading. (C) Dynamic light scattering zeta potential spectra of oxSWCNT, SWCNT· before PVP functionalization, SWCNT· + CD105, and SWCNT· + CD105 + DOX showing the corresponding surface charge at the different steps of carbon nanotubes synthesis. (D) Characteristic ESR spectrum of SWCNT· + CD105 + DOX sample recorded at room temperature using a magnetic field ranging from 2,000 Gauss to 4,000 Gauss.
Abbreviations: TEM, transmission electron microscopy; DOX, doxorubicin; SWCNT, single-walled carbon nanotube; oxSWCNT, oxidized SWCNT; PVP, polyvinylpyrrolidone; ESR, electron spin resonance; OD, optical density; Mag, magnification; UV-vis, ultraviolet-visible.
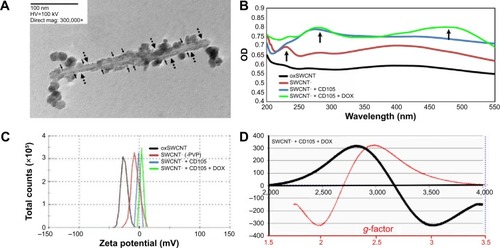
Figure 3 SWCNTs biocompatibility assessments.
Notes: (A) cell apoptosis (TACS), (B) DNA damage (PARP), and (C) oxidative stress generation (TBARS) of iron-tagged SWCNTs (ie, SWCNT·) and CD105 and DOX-conjugated SWCNT· (ie, SWCNT· + CD105 + DOX) incubated with 4T1 tumor cells. *P<0.05 vs SWCNT·. Therapeutic efficacy (D) (percentage of photon flux by bioluminescence imaging) of free DOX drugs compared to DOX-loaded SWCNT· (ie, SWCNT· + DOX and SWCNT· + CD105 + DOX) conjugates. Cells were incubated for 2 hours, 24 hours, 48 hours, or 72 hours with either SWCNT samples at 2.5 μg/mL, 5 μg/mL, 7.5 μg/mL, or 10 μg/mL or DOX suspensions at corresponding drug loading at 5 μg/mL, 10 μg/mL, 15 μg/mL, and 20 μg/mL. *P<0.05 vs DOX. Data expressed as mean ± SD, n=3 per group.
Abbreviations: TACS, TiterTACS™ Colorimetric Apoptosis Detection Kit; PARP, poly (ADP-ribose) polymerase; TBARS, thiobarbituric acid-reactive substances; SWCNT, single-walled carbon nanotube; DOX, doxorubicin; SD, standard deviation; OD, optical density; BLI, bioluminescence imaging; h, hours.
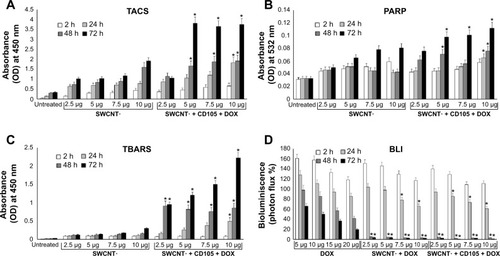
Figure 4 Noninvasive bioluminescence imaging (BLI).
Notes: (A) Representative noninvasive bioluminescence images (radiance efficiency) of tumor-bearing mice at 0 days, 3 days, 7 days, 10 days, and 14 days following injection of either SWCNT· + CD105 (upper row) or DOX-loaded SWCNT· + CD105 (lower row) showing the progression of tumor and eventual metastasis following inoculation of 4T1-Luc2 breast cancer cells in the left inguinal mammary fat pad. (B) Quantitative assessments of radiance efficiency following iv injection of either free DOX or CD105-conjugated SWCNT samples with or without either iron tagging (·) or drug loading (DOX) performed to assess treatment-induced responses. Black arrows highlight the time of DOX or SWCNT conjugate injections. Data expressed as mean ± SD, n=6 per group. *P<0.05 vs SWCNT + CD105.
Abbreviations: SWCNT, single-walled carbon nanotube; DOX, doxorubicin; Luc2, luciferase; SD, standard deviation; iv, intravenous.
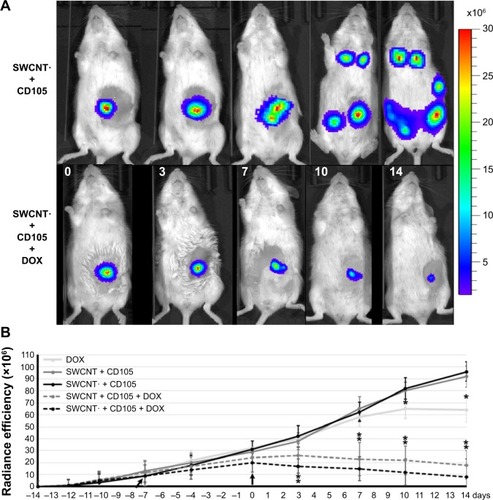
Figure 5 Tumor volume quantification using MRI.
Notes: Tumor volume quantified by MRI using a fast spin echo Turbo RARE following injection of 4T1-Luc2 breast cancer cells in the left inguinal mammary fat pad of a murine model. Tumor volume was measured after iv injection of free DOX and CD105-conjugated SWCNT samples with or without either iron tagging (·) or drug loading (DOX) as theranostic nanoprobes. Black arrows highlight the time of DOX or SWCNT conjugate injections. Data expressed as mean ± SD, n=6 per group. *P<0.05 vs SWCNT + CD105.
Abbreviations: MRI, magnetic resonance imaging; RARE, rapid acquisition with refocused echoes; Luc2, luciferase; DOX, doxorubicin; SWCNT, single-walled carbon nanotube; SD, standard deviation; iv, intravenous.
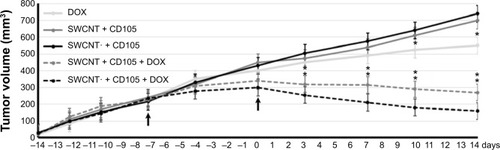
Figure 6 T2* quantifications using MR imaging.
Notes: (A) Representative MR images of tumor-bearing mice at 0 hours (preinjection), 2 hours, and 14 days post-iv injection with CD105 antibody-conjugated, DOX-loaded SWCNTs conjugated with (·) or without iron oxide nanoparticles tagging, which were acquired using multi-gradient echo MR pulse sequence at 4.7 T magnet. Images with the shortest echo time (ie, TE =5 ms) were presented. T2* values were quantified in the tumor sites and presented in the color map. (B) Quantification of T2* (ms) in the primary tumor site at 0 hours (preinjection), 2 hours, 7 days, and 14 days post-iv injection with either free DOX suspensions or CD105-conjugated SWCNT nanocarriers with or without either iron-tagging (·) or drugs loading (DOX). Data expressed as mean ± SD, n=6 per group. *P<0.05.
Abbreviations: MR, magnetic resonance; DOX, doxorubicin; SWCNT, single-walled carbon nanotube; SD, standard deviation; h, hours; d, days; post-iv, post-intravenous.
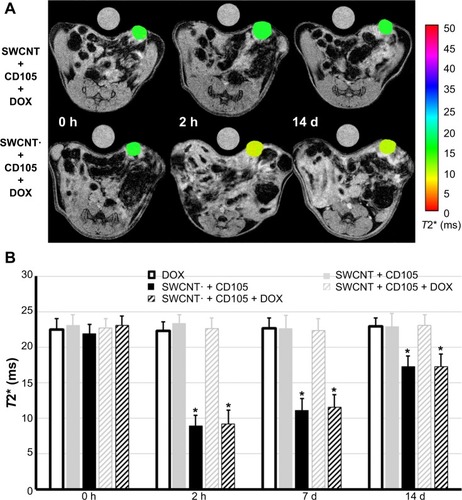
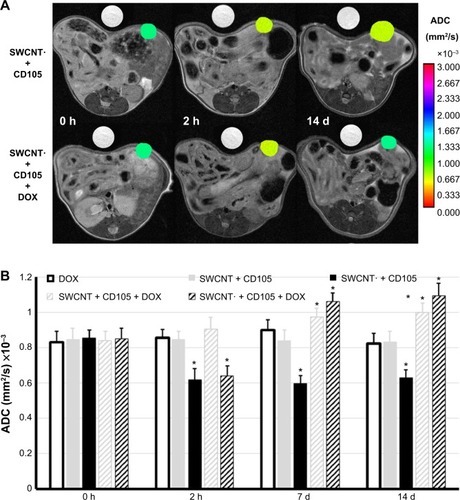
Figure 7 ADC measurements using DW-MR imaging.
Notes: (A) Representative MR images of tumor-bearing mice at 0 hours (preinjection), 2 hours, and 14 days post-iv injection with iron-tagged, CD105-conjugated SWCNTs (ie, SWCNT· + CD105) before and after DOX loading (ie, SWCNT· + CD105 + DOX), which were acquired using fast spin echo MR pulse sequence at 4.7 T magnet. Images with the shortest b value (ie, b=0) were presented. ADC measurements in the tumor sites are presented as a color map. (B) Quantification of ADC values (mm2/s) in the primary tumor site at 0 hours (preinjection), 2 hours, 7 days, and 14 days post-iv injection with either free DOX suspensions or CD105-conjugated SWCNT nanocarriers with or without either iron-tagging (·) or drugs loading (DOX). Data expressed as mean ± SD, n=6 per group. *P<0.05.
Abbreviations: MR, magnetic resonance; SWCNT, single-walled carbon nanotube; DOX, doxorubicin; DW, diffusion-weighted; ADC, apparent diffusion coefficient; SD, standard deviation; h, hours; d, days; post-iv, post-intravenous.