Figures & data
Table 1 The particle size, zeta potential, drug-loading efficiency, and EE measurements of PTX-loaded nanoparticles
Figure 1 (A) Representative images of LPPs visualized by TEM. (B) Cumulative release of PTX from PEGylated nanoparticles in water containing 0.1% Tween 80 at 37°C.
Note: The error bars represent the SD (n=3).
Abbreviations: PTX, paclitaxel; SD, standard deviation; LPP, nanoparticles modified by poly(ethylene glycol)-b-poly(ε-caprolactone); LDP2000, nanoparticles modified by 1,2-distearoyl-sn-glycero-3-phospho-ethanolamine-N-(methoxy[polyethyleneglycol])-2000; TEM, transmission electron microscope.
![Figure 1 (A) Representative images of LPPs visualized by TEM. (B) Cumulative release of PTX from PEGylated nanoparticles in water containing 0.1% Tween 80 at 37°C.Note: The error bars represent the SD (n=3).Abbreviations: PTX, paclitaxel; SD, standard deviation; LPP, nanoparticles modified by poly(ethylene glycol)-b-poly(ε-caprolactone); LDP2000, nanoparticles modified by 1,2-distearoyl-sn-glycero-3-phospho-ethanolamine-N-(methoxy[polyethyleneglycol])-2000; TEM, transmission electron microscope.](/cms/asset/f8dc9f6e-51cf-45fb-a6a3-a870797253c1/dijn_a_75186_f0001_c.jpg)
Figure 2 (A) Uptake of DiI-loaded nanoparticles by 4T1 cells was investigated qualitatively by CLSM. Scale bars represent 10 μm. (B, C) Uptake of DiI-loaded nanoparticles by 4T1 cells was investigated qualitatively by FCM. (D) The endocytosis inhibition assay on 4T1 cells is shown.
Notes: For uptake evaluation, 4T1 cells were treated with DiI-loaded PEGylated nanoparticles for 4 hours before measurements. For endocytosis inhibition assay, after pre-incubation with different inhibitors for 30 minutes, cells were treated with DiI-loaded PEGylated nanoparticles for another 4 hours (n=3). * and ** indicate P<0.05 and P<0.01 versus the control group.
Abbreviations: CLSM, confocal laser scanning microscopy; FCM, flow cytometry.
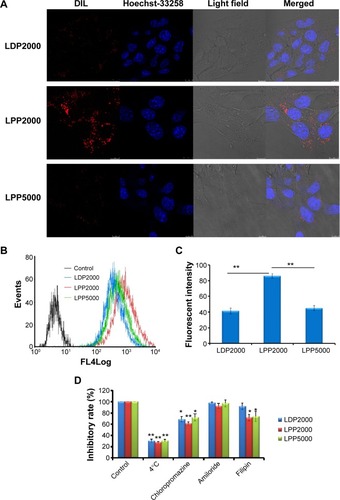
Figure 3 In vitro cytotoxicity of PTX formulations and blank formulations against 4T1 cell line.
Notes: (A) Represents the cytotoxicity of PTX-loaded formulations and free PTX. (B) Represents the cytotoxicity of blank formulations (x-axis shows corresponding PTX concentrations of blank formulations) and solvents for free PTX (ethanol mixed with Cremophor ELP 35 with a volume ratio of 1:1) on 4T1 cell lines for 48 hours. Data were given as mean ± SD (n=5). *Represents statistically significant difference P<0.05 versus LDP2000, #represents statistically significant difference P<0.05 versus free PTX, and $represents statistically significant difference P<0.05 versus LPP5000. &Represents statistically significant difference P<0.05.
Abbreviations: PTX, paclitaxel; SD, standard deviation.
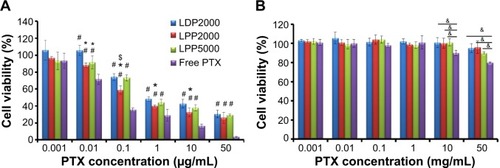
Table 2 Pharmacokinetic parameters
Figure 4 (A) The PTX concentration–time curves in rat blood plasma after intravenously administrated free PTX and PTX-loaded PEGylated nanoparticles at a PTX dose of 10 mg/mL. (B) Representative images of breast tumor–bearing BALB/c mice 24 hours after injection of free DiR- and DiR-labeled nanoparticles. The arrows indicate the tumors.
Abbreviation: PTX, paclitaxel.
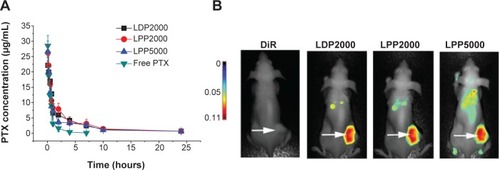
Figure 5 Intravenous administration of PTX formulations inhibited the growth of 4T1 murine breast tumors in vivo and prolonged the survival of treated mice.
Notes: (A) Suppression of tumor growth in each treatment group. The arrows indicate the injection of PTX formulations. (B) PTX groups versus the saline or LPP2000 group, with tumor growth inhibition of PTX formulations. (C) Weight of subcutaneously transplanted tumors in each treatment group. (D) Survival curves of mice in each group. * and ** represented P<0.05 and P<0.01, respectively.
Abbreviation: PTX, paclitaxel.
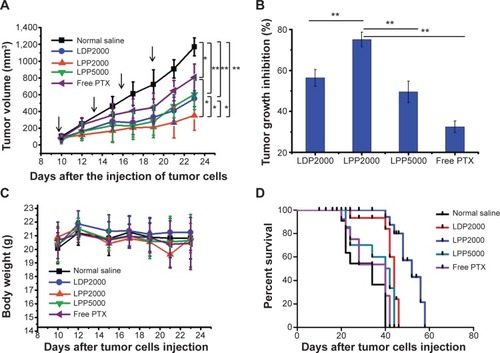
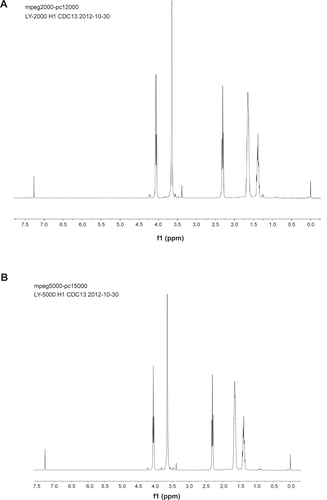
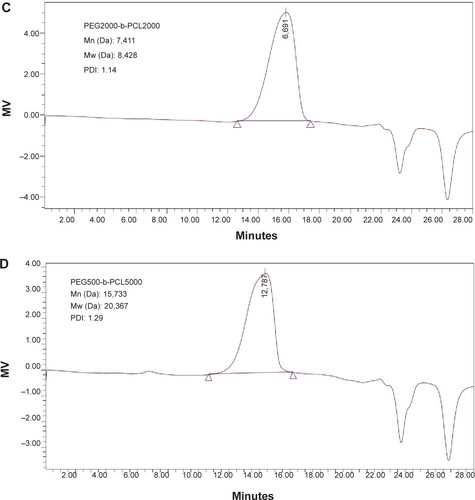
Figure S1 Characterization of PEG-b-PCL.
Notes: (A) and (B) represent 1H NMR spectrums of PEG2000-b-PCL2000 and PEG5000-b-PCL5000. (C) and (D) represent GPC traces of PEG2000-b-PCL2000 and PEG5000-b-PCL5000.
Abbreviations: PEG-b-PCL, poly(ethylene glycol)-block-poly(ε-caprolactone); GPC, gel permeation chromatography; NMR, nuclear magnetic resonance; Mn, number-average molecular weight; Mw, weight-average molecular weight; PDI, polydispersity; MV, millivolt.