Figures & data
Figure 1 Construction, characterization, and distribution of f(SPION-PEG-mAb) nanoprobe within labeled cells by TEM and CLSM.
Notes: (A) Schematic representation of the negatively charged SPION-PEG complex through electrostatic interaction. The cardiac specific mAb receptors are bound to SPION-PEG micelle through covalent bonding. The engineered cardiac specific nanoprobe when incubated with hADSCs of stromal vascular fraction yields positively selected cells through the MACS column. (B) TEM images of SPION (167 nm), SPION-PEG (250 nm), and SPION-PEG-mAb (300 nm) (SIRPA) showing variation in their size upon surface modification. SPION-PEG-mAb (SIRPA) complex image using confocal microscopy demonstrates an SPION aggregate in dark tagged to PEG (FITC; green), SIRPA mAb (PE; red) using laser power of 60%, and a gain of 850 settings.
Abbreviations: CLSM, confocal laser scanning microscope; FITC, fluorescein isothiocyanate; hADSC, human adipose-derived stem cell; mAb, monoclonal antibodies; PE, phycoerythrin; PEG, polyethylene glycol; SIRPA, signal regulatory protein alpha; SPION, superparamagnetic iron oxide nanoparticle; TEM, transmission electron microscopy; MACS, magnetic activated cell sorter; KDR, kinase domain receptor.
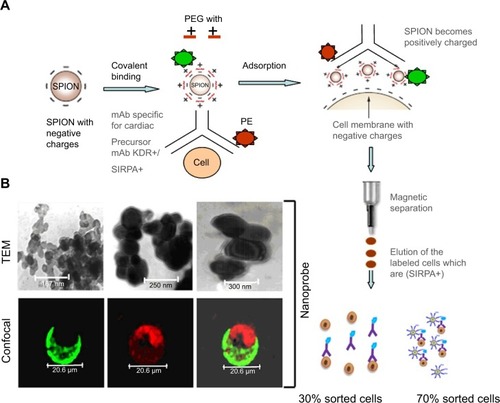
Figure 2 Segregation of cardiac progenitor cells from SVF using the SPION-based nanoprobe for MR imaging.
Notes: (A) Labeling of cells by SPION complexes with SIRPA and CD105 antibodies and cell sorting. SVF isolated from adipose tissue was incubated with SPION complexes at 4°C for 24 hours. The cells were sorted using MACS column and analyzed by flow cytometry for SIRPA and CD105 expression. As shown in the dot plots, the sorted cells (green) are positive for SIRPA and CD105 in the FL2 and FL3 channels, respectively. The unstained cells (shown as red on the dot plot) are negative for SIRPA and CD105 expression. (B) A 3T MRI of the phantom gel was performed to measure the T2 relaxivity of the nanoprobe-labeled cells. Experimental set-up was designed with different cell numbers of MACS sorted cells. Parameters for coronal T2-weighted TSE imaging used during scanning were as follows: TR, 6,250 ms; TE, 150 ms; field of view, 190×230 mm3; slice thickness, 2 mm; acquisition time, 5 minutes; echo train length, 16; and voxel size, 0.6×0.8×2 mm3. SPION alone, unlabeled cells, and gelatin alone served as MRI controls. SIRPA+/CD105+ cells with SPION (50 μg) in a 3T MR imaging revealed an optimum concentration at 1.5×10⁵ cells.
Abbreviations: MACS, magnetic activated cell sorter; MRI, magnetic resonance imaging; SIRPA, signal regulatory protein alpha; SPION, superparamagnetic iron oxide nanoparticle; SVF, stromal vascular fraction; TE, time to echo; TR, time to repetition.

Figure 3 Determination of apoptotic/necrotic effects of the f(SPION-PEG-mAb) in labeled cells.
Notes: (A and C) hADSCs were incubated with SPION complexes as described earlier and then subjected to annexin V-FITC and TUNEL assays as per the manufacturer’s instructions. FITC and fluorescence quantification were performed using flow cytometry. Unlabeled, labeled, and 20 μm H2O2-treated cells were used for analysis. A difference was detected as a shift in the peak compared to that of the unstained control (shown as the green overlay in the histogram). (B) Detection of apoptosis by ROS assay. Labeled, unlabeled, and 20 μM H2O2-treated cells were incubated with DHE as described in the methods and then processed for fluorescence quantification using flow cytometry and fluorescence microscopy. Microscope images are placed within the histogram panel. Nuclei are stained with DAPI (blue, not shown), and green fluorescence indicates positive staining for DHE. (D) Evaluation of DNA damage by Comet assay. Labeled, unlabeled, and 20 μM H2O2-treated cells were used as positive controls for apoptosis in the comet assay following the manufacturer’s protocols. To determine the extent of DNA damage after electrophoresis, comet slides were stained with DAPI. The red circles marked within the figure indicate damaged DNA with the typical comet head and tail. (E) Karyogram performed on the cultured cells revealed a normal female karyotype. (F) The cytotoxicity of SPION complexes for unlabeled, labeled, and H2O2-treated cells was also evaluated by MTT assay. (G) Caspase-3 activity demonstrated least cytotoxicity. (H and I) Negligible production of inflammatory cytokines such as IFN-γ and TNF-α by ELISA.
Abbreviations: DNA, deoxyribonucleic acid; ELISA, enzyme-linked immunosorbent assay; FITC, fluorescein isothiocyanate; hADSC, human adipose-derived stem cell; IFN-γ, interferon gamma; mAb, monoclonal antibody; PEG, polyethylene glycol; ROS, reactive oxygen species; SPION, superparamagnetic iron oxide nanoparticle; TNF-α, tumor necrosis factor alpha; TUNEL, terminal deoxynucleotidyltransferase-mediated UTP end labeling; MTT, 3,4,5-dimethylthiazol-2-yl)-2-5-diphenyltetrazolium bromide; OD, optical density; DAPI, N-2-(diethylaminoethyl)-9-hydroxyellipticinium chloride. DHE, dihydroethidium.
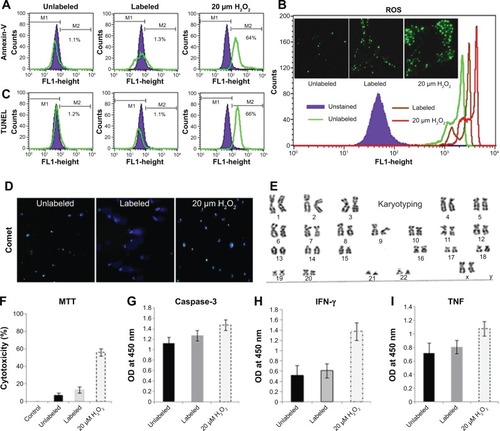
Figure 4 Labeling efficiency of nanoprobe and its iron degradation pattern within the labeled cells maintained in long-term culture.
Notes: (A) The Prussian blue panel shows SPIONs as blue dots within the cytoplasm of labeled cells that was counterstained with eosin. The JC-1 panel shows the potential viability of labeled cells as evident from the orange J aggregates. (B) Kinetics of iron degradation in the labeled hADSCs by UV spectrophotometry. hADSCs were labeled with the SPION-PEG (50 μg/1.5×106 cells) complex overnight and maintained in the required culture conditions for 7–10 days to assess iron degradation kinetics. Labeled cells were trypsinized at different time points and incubated overnight at 90°C. Intracellular iron was dissolved using 5 M HCl at 60°C for 4 hours. Iron content was measured by UV spectrophotometry at 340 nm. (C–D) TEM image of hADSCs labeled with SPION complexes. The internalization of SPIONs and their localization within the cell cytoplasm were visualized at 333 nm and 2.5 μm. Several endocytic vesicles visible inside the cytoplasm indicate internalization of SPIONs through endocytosis. (D) Cardiac precursors from SVF tagged to PEG (FITC; green) and mAb (PE; red), counter-stained the nucleus with (DAPI; blue).
Abbreviations: hADSC, human adipose-derived stem cell; SPION-PEG, superparamagnetic iron oxide nanoparticle-polyethylene glycol; TEM, transmission electron microscopy; UV, ultraviolet; JC-1, (5,5′,6,6′-tetrachloro-1,1′,3,3′-tetraethylbenzimi-dazolylcarbocyanine iodide); FITC, fluorescein isothiocyanate; DAPI, N-2-(diethylaminoethyl)-9-hydroxyellipticinium chloride; PE, phycoerythrin.
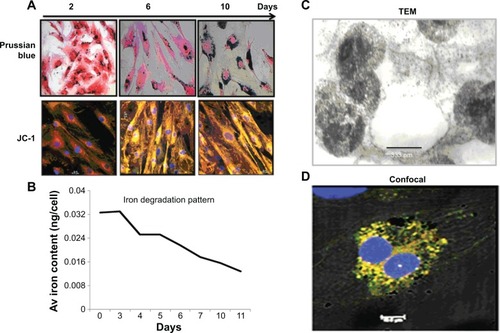
Figure 5 Differentiation potential of labeled cells into cardiac lineages.
Notes: (A) Differentiation of nanoprobe labeled cells into cardiomyocytes. Cardiomyocytes were characterized for the presence of cardiac specific markers (SIRPA and KDR) and mesenchyme markers (CD105) using flow cytometry. (B) Differentiation of cardiomyocytes was further confirmed through positive expression of SIRPA, KDR, actin, desmin, and troponin I by ICC using CLSM. Nucleus is stained blue (DAPI) and presence of specific protein is indicated as green (A-488). Weak to strong staining indicates the level of expression in the differentiated cells. The CLSM settings used was about 60% laser power and 800–850 gain parameters.
Abbreviations: ADSC, adipose-derived stem cell; CLSM, confocal laser scanning microscope; KDR, kinase domain receptor; ICC, imuunocytochemistry; SIRPA, signal regulatory protein alpha; DAPI, N-2-(diethylaminoethyl)-9-hydroxyellipticinium chloride.
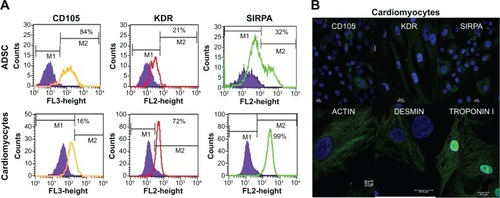
Figure 6 (A) An MRI of the phantom gel was performed to measure the T2 relaxivity of the SPION complex-labeled cells using 3TMR. Two experimental set-ups were designed, one with fixed SPION concentration (50 μg/well) and variable cell numbers (0.0625–1.0×10⁶ cells) and another with a fixed cell number (1×10⁵ cells) and different SPION concentrations (3.175–50 μg/well). (B) Parameters for coronal T2-weighted TSE imaging used during scanning were as follows: TR, 6250 ms; TE, 150 ms; field of view, 190×230 mm3; slice thickness, 2 mm; acquisition time, 5 minutes; echo train length, 16; and voxel size, 0.6×0.8×2 mm3). SPIONs alone, unlabeled cells and gelatin alone served as MRI controls.
Abbreviations: MRI, magnetic resonance imaging; 3T, 3 tesla; SPION, superparamagnetic iron oxide nanoparticle; TSE, turbo spin echo; TR, repetition time; TE, echo time.
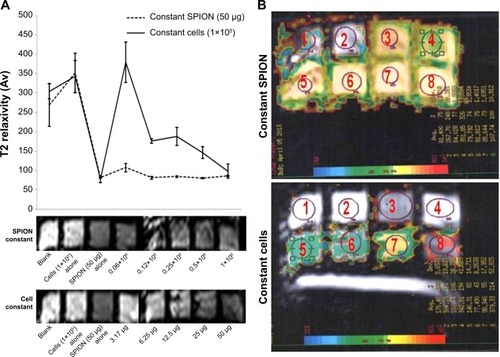
Figure S1 Independent cytotoxicity assays of SPIONs and different biopolymers on MSCs.
Notes: Mesenchymal stem cells were incubated with different concentrations of SPIONs and biopolymers for 24 hours. The cells were then exposed to 0.5 mg/mL MTT for 4 hours, and the formazan crystals were dissolved by DMSO. Absorbance was measured at 540 nm, and percent cell viability for each treatment was plotted.
Abbreviations: Conc, concentration; DMSO, dimethyl sulfoxide; MSC, mesenchymal stem cells; SPION, superparamagnetic iron oxide nanoparticle; MTT, 3,4,5-dimethylthiazol-2-yl)-2-5-diphenyltetrazolium bromide.
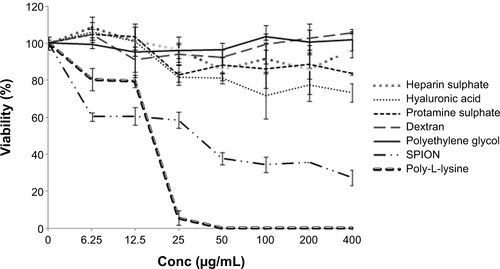
Figure S2 Cytotoxicity of SPION:PEG complexes at different ratios on MSCs measured by MTT assay.
Abbreviations: MSCs, mesenchymal stem cells; SPION:PEG, superparamagnetic iron oxide nanoparticle-polyethylene glycol; MTT, 3,4,5-dimethylthiazol-2-yl)-2-5-diphenyltetrazolium bromide.
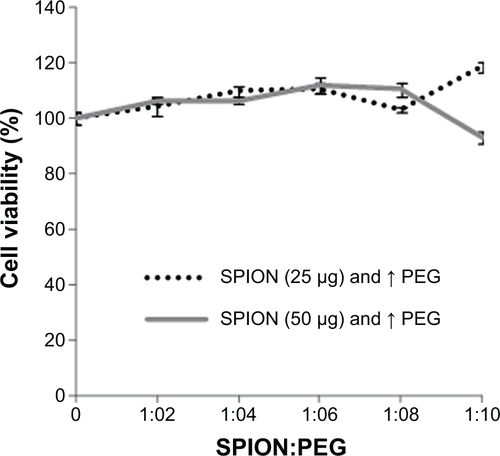
Figure S3 Schematic representation of the nanoprobe protocol yielding 70% positively selected cells with good viability and least cytotoxicity as evaluated by the MTT assay.
Abbreviations: Ab, antibody; h, hours; MACS, magnetic activated cell sorter; PerCp, peridinin chlorophyll; RT, room temperature; SPION, superparamagnetic iron oxide nanoparticle; PEG, polyethylene glycol; MTT, 3,4,5-dimethylthiazol-2-yl)-2-5-diphenyltetrazolium bromide.
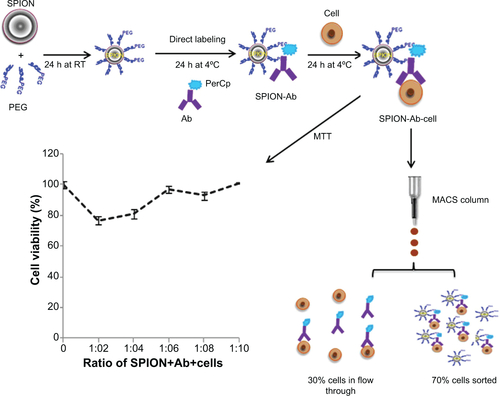
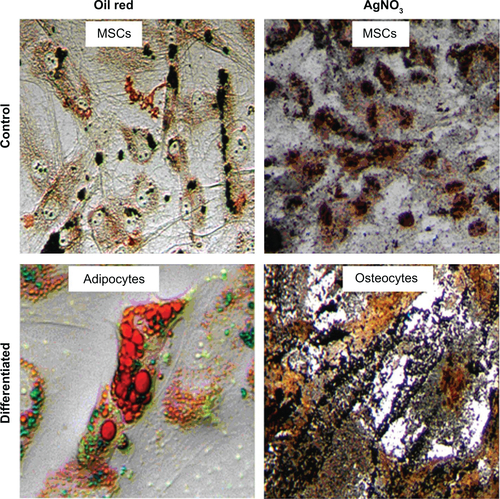
Figure S4 The differentiation potential of the positively selected cells with internalized SPIONs to adipocyte and osteocyte lineages as against mesenchymal stem cells as controls without any mAb tagging.
Abbreviations: mAb, monoclonal antibody; SPION, superparamagnetic iron oxide nanoparticle; MSCs, mesenchymal stem cells.