Figures & data
Figure 1 Schematic diagram of the preparation and biological evaluation of the PEEK/n-HA/CF ternary biocomposite.
Abbreviations: HA, hydroxyapatite; PEEK, polyetheretherketone; PEEK/n-HA/CF, carbon fiber-reinforced polyetheretherketone–nanohydroxyapatite.
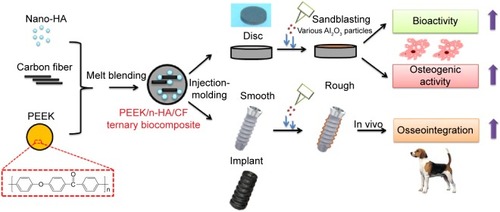
Figure 2 Chemical characterization of the pristine PEEK/n-HA/CF ternary composite.
Notes: (A) FT-IR spectrum; (B) XRD pattern.
Abbreviations: PEEK, polyetheretherketone; CF, carbon fiber; HA, hydroxyapatite; PEEK/n-HA/CF, carbon fiber-reinforced polyetheretherketone–nanohydroxyapatite; FT-IR, Fourier-transform infrared spectrometry; XRD, X-ray diffraction.
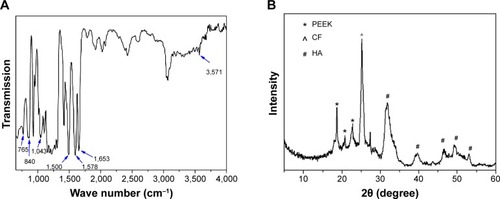
Table 1 Mechanical properties for PEEK, Ti, and PEEK/n-HA/CF composites showing the mean ± standard deviation hardness, elastic modulus, and UTS for each group
Table 2 The roughness and atomic percentage of the Ca/P element for various microroughened PEEK/n-HA/CF ternary composites showing the mean ± standard deviation
Figure 3 SEM images of the microroughened PEEK/n-HA/CF ternary composites.
Notes: (A) Control; (B) group 1; (C) group 2; and (D) group 3 with high-resolution images inserted on the top right.
Abbreviations: SEM, scanning electron microscope; PEEK/n-HA/CF, carbon fiber-reinforced polyetheretherketone–nanohydroxyapatite.
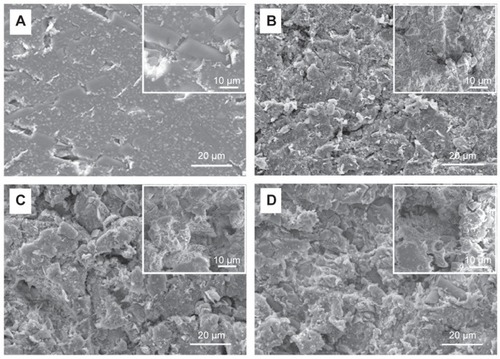
Figure 4 Elemental compositions and water contact angles of the specimens.
Notes: (A) Elemental compositions of various microroughened specimens measured by XPS. (B) Water contact angles measured on the samples with typical water droplet images inserted. *P<0.05.
Abbreviation: XPS, X-ray photoelectron spectroscopy.
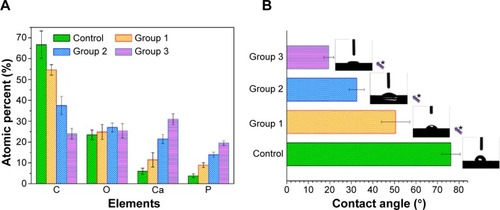
Figure 5 Cell adhesion and cell proliferation rates cultured on various PEEK/n-HA/CF composites and adhesion morphology and actin cytoskeletal organization of cells after incubation with different samples.
Notes: (A) Cell adhesion (4 hours) and (B) cell proliferation rates cultured on various PEEK/n-HA/CF composites for 3 days, 7 days, and 14 days. (C) The adhesion morphology and actin cytoskeletal organization (red, labeled with rhodamine–phalloidin) of cells after incubation with different samples at 7 days. *P<0.05.
Abbreviations: OD, optical density; PEEK/n-HA/CF, carbon fiber-reinforced polyetheretherketone–nanohydroxyapatite.
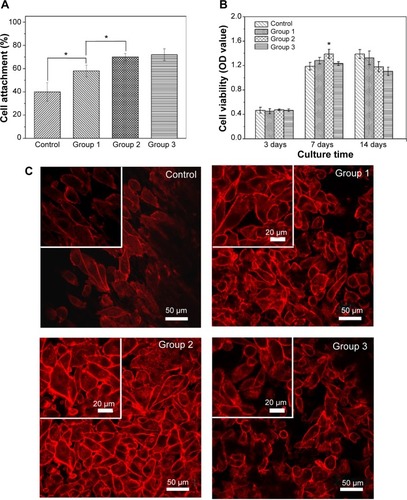
Figure 6 Flow cytometric analyses of cell apoptosis after treatment with the different composites for 7 days.
Notes: (A) Typical figures for flow cytometric analysis of necrotic cells (X-axis, PI fluorescence) versus apoptotic cells (Y-axis, Annexin V-FITC) at 7 days. (B) The percentages of apoptotic cells for different groups. (C) The percentage of necrotic cells for different groups. *P<0.05 compared to the control group. **P<0.01 compared to the control group.
Abbreviations: FITC, fluorescein isothiocyanate; PI, propidium iodide.
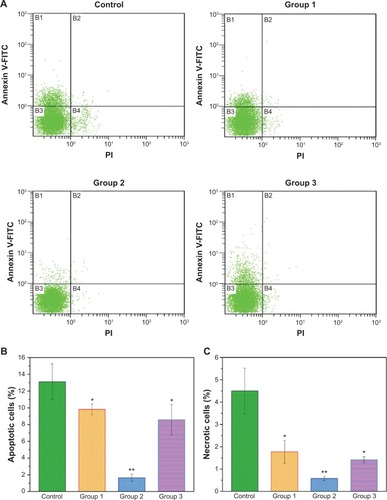
Figure 7 Osteogenic differentiation of MG-63 cells on the surfaces of various microrough PEEK/n-HA/CF biocomposites.
Notes: (A) ALP activity after cultivating for 7 days and 14 days. (B) Mineralized nodules after cultivation for 14 days. (C) ARS of the production of the mineralized extracellular matrix of cells cultured onto the microrough surfaces of (a) the control group, (b) group 1, (c) group 2, and (d) group 3 on day 14. *P<0.05 compared to the other groups.
Abbreviations: ALP, alkaline phosphatase; PEEK/n-HA/CF, carbon fiber-reinforced polyetheretherketone–nanohydroxyapatite; ARS, Alizarin red staining.
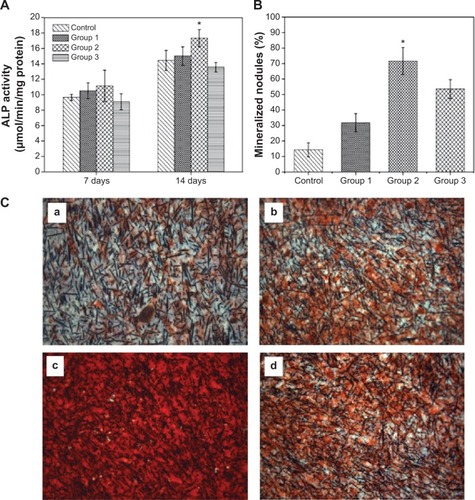
Figure 8 Bioaffinity evaluation of the protein adsorption of the different microroughened PEEK/n-HA/CF composite groups.
Abbreviations: h, hours; PEEK/n-HA/CF, carbon fiber-reinforced polyetheretherketone–nanohydroxyapatite.
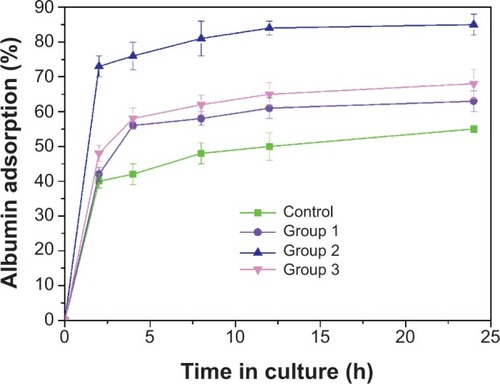
Figure 9 Radiographs and SRμCT scan of a beagle’s mandible with bare and micromodified threaded PEEK/n-HA/CF ternary implants for 8 weeks of implantation.
Notes: (A) Radiographs and (B) SRμCT scan of a beagle’s mandible. The green arrows refer to the interfaces between bone tissue and implants.
Abbreviations: PEEK/n-HA/CF, carbon fiber-reinforced polyetheretherketone–nanohydroxyapatite; SRμCT, synchrotron–radiation-based computer microtomography.
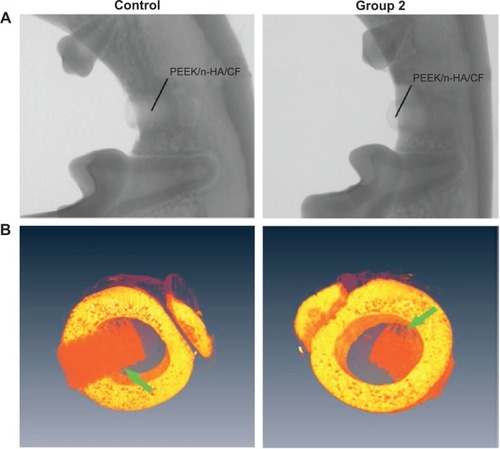
Figure 10 Micro-CT reconstruction models and micro-CT results after 8 weeks of implantation.
Notes: (A) Micro-CT 3D reconstruction models showing regeneration of microstructures about 0.5 mm in thickness bonding to polished and microrough PEEK/n-HA/CF implants at 8 weeks. (B) Micro-CT results containing the percent of BV/TV, BMD, TbTh, and TbN after 8 weeks of implantation. *P<0.05 compared to the control group. **P<0.01 compared to the control group.
Abbreviations: BV/TV, bone volume/tissue volume; BMD, bone mineral density; TbTh, trabecular thickness; TbN, trabecular number; CT, computed tomography; 3D, three-dimensional; PEEK/n-HA/CF, carbon fiber-reinforced polyetheretherketone–nanohydroxyapatite.
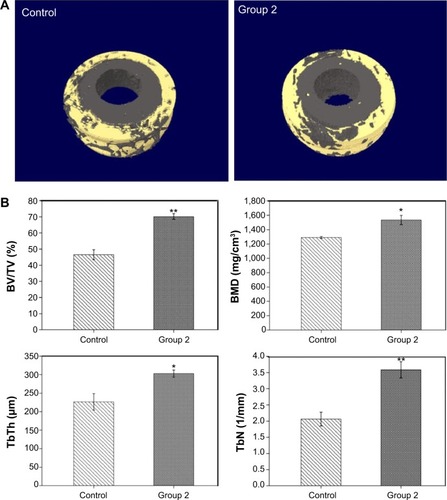
Figure 11 Histology and histomorphometric analysis of the polished and microroughened PEEK/n-HA/CF biocomposite implants.
Notes: (A) Histotomy of bone contact immunostained by toluidine blue–fuchsine staining at 8 weeks with low and high magnification. The pink area represents the newly-formed bone, and dark black area represents the implants. (B) Fluorochrome labeling and quantitative determination with calcein and tetracycline show the greater new bone formation on the surface of the microroughened CFRPEEK-based biocomposite. *P<0.05 compared to the control.
Abbreviations: PEEK/n-HA/CF, carbon fiber-reinforced polyetheretherketone–nanohydroxyapatite; CFRPEEK, carbon fiber-reinforced polyetheretherketone.
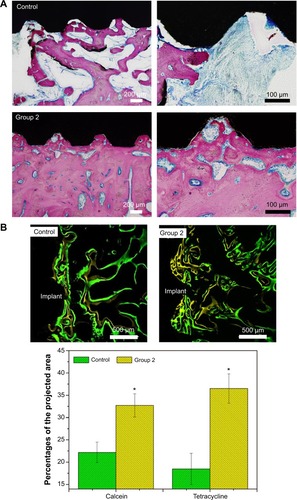
Figure S1 SEM images of different Al2O3 grains used for sandblasting treatment.
Notes: (A) Al2O3 particles with a grain size of 60–80 μm; (B) Al2O3 particles with a grain size of 110–150 μm; (C) Al2O3 particles with a grain size of 180–250 μm.
Abbreviation: SEM, scanning electron microscope.
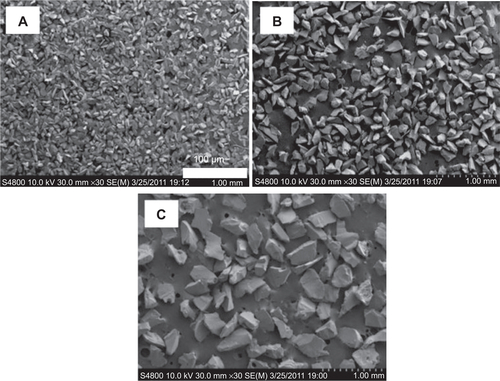
Figure S2 Energy-dispersive X-ray spectroscopy analysis of the control group, group 1, group 2, and group 3 of the PEEK/n-HA/CF ternary biocomposites.
Notes: (A) Control group; (B) group 1; (C) group 2; and (D) group 3 of the PEEK/n-HA/CF ternary biocomposites.
Abbreviations: At%, atom percentage; PEEK/n-HA/CF, carbon fiber-reinforced polyetheretherketone–nanohydroxyapatite.
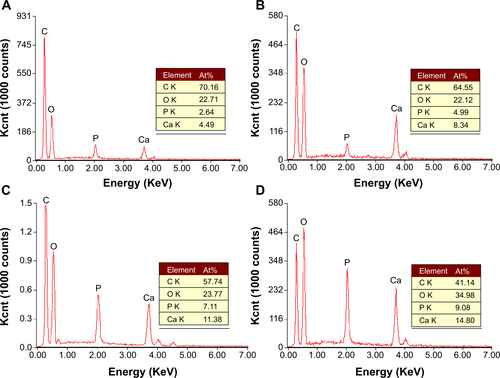
Figure S3 Scanning electron microscope images of osteoblast-like cells on the surfaces of the control and group 2 samples cultured for 14 days.
Notes: (A) Control group; (B) group 2.
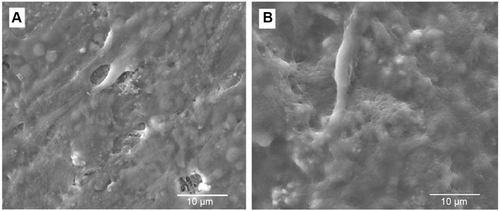
Figure S4 The number of adherent cells per projected area on the different biocomposite surfaces calculated by immunofluorescence.
Note: *P<0.05 compared to other groups.
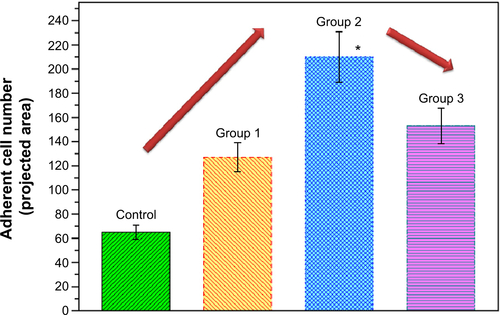
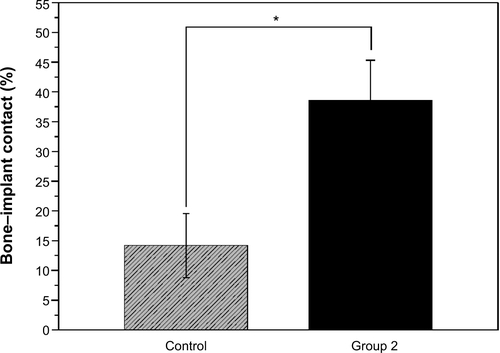
Figure S5 Percentage of bone–implant contact for the control and group 2 implants at 8 weeks.
Note: *P<0.05.