Figures & data
Figure 1 The schematic diagram of electrospinning setup for core–sheath PS/gelatin nanofibrous membrane
Abbreviation: PS, polystyrene.
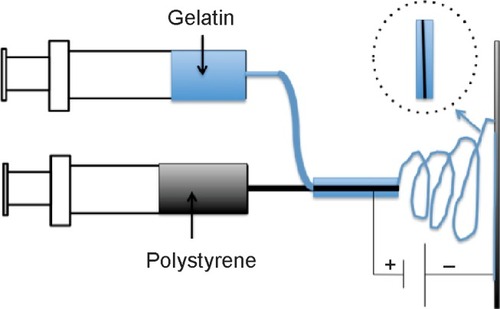
Table 1 Primer sequences for qRT-PCR analysis
Figure 2 SEM images of PS (A), gelatin (B), and PS/gelatin nanofibrous membrane (C); confocal fluorescent image of FITC–gelatin/PS fiber (D).
Notes: Original magnifications: ×2,000 (A–C).
Abbreviations: FITC, fluorescein isothiocyanate; PS, polystyrene; SEM, scanning electron microscopy.
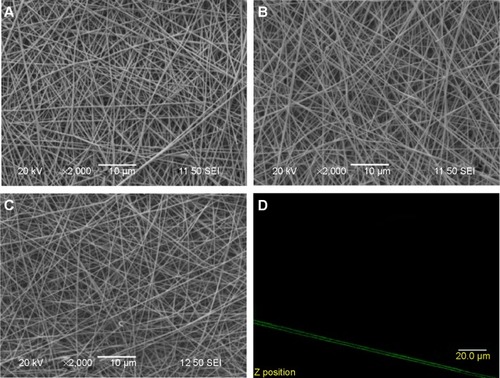
Figure 3 FTIR–ATR spectra of gelatin (A), polystyrene (B), and polystyrene-modified gelatin (C).
Abbreviations: ATR, attenuated total reflection; FTIR, Fourier transform infrared spectroscopy.
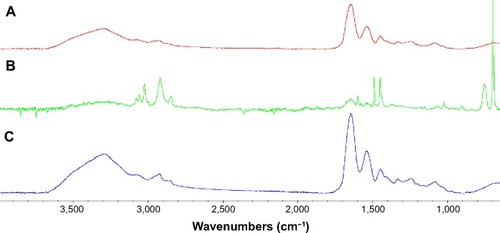
Figure 4 Cell growth on the surface of PS (A), gelatin (B), and PS/gelatin (C) nanofibrous membrane.
Abbreviation: PS, polystyrene.
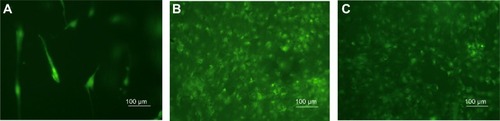
Figure 5 Inflammation responses to PS/gelatin at different time points postsurgery (black arrows: giant cells; scale bar =50 μm).
Notes: 1 W, 2 W, 3 W, 4 W, and 6 W indicate 1 week, 2 weeks, 3 weeks, 4 weeks, and 6 weeks, respectively.
Abbreviation: PS, polystyrene.
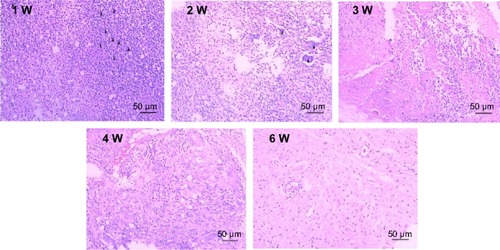
Figure 6 T-cell responses to PS/gelatin at different time points postsurgery (black arrows: positive cells).
Abbreviations: PS, polystyrene; Th, T helper cell.
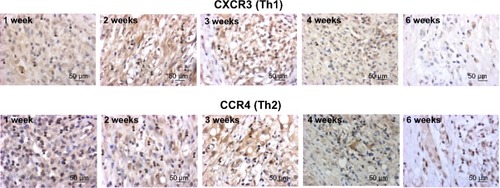
Figure 7 Macrophage cell responses to PS/gelatin at different time points postsurgery (black arrows: positive cells).
Abbreviation: PS, polystyrene.
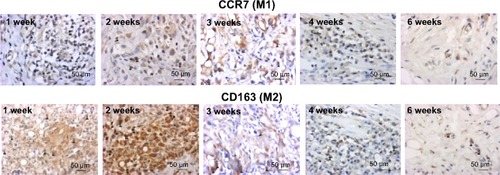
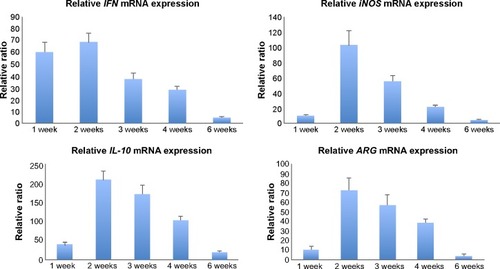
Figure 8 Gene expression of IFN-γ, iNOS, IL-10, and ARG in explanted tissues at different time points.
Abbreviations: IFN, interferon; iNOS, inducible nitric oxide synthase; IL, interleukin; ARG, arginase.