
Figures & data
Table 1 Principal characteristics of used Ag NPs of different origins
Figure 1 Antiproliferative efficacies of biosynthesized Ag NPs produced by Cryptococcus laurentii at different concentrations.
Notes: MTT assay was used on MCF7, T47D, and MCF10-A. All values are expressed as the means of the difference between optical density at 480 and 690 nm ± standard deviation.
Abbreviations: Ag NPs, silver nanoparticles; OD, optical density; MTT, 3-(4,5-dimethylthiazol-2-yl)-2,5-diphenyltetrazolium bromide.
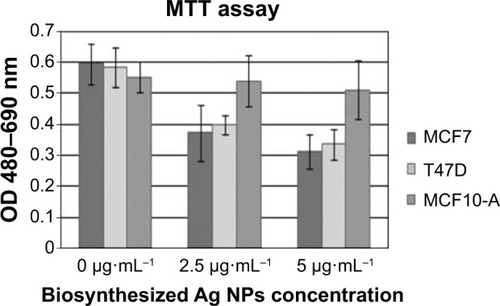
Figure 2 Annexin V-FITC flow cytometry assay.
Notes: Negative annexin V populations are presented in P1 columns while positive populations are presented in P2 columns. Bar chart comparing effect of 0, 2.5, and 5 μg⋅mL−1 Ag NPs produced by Cryptococcus laurentii after 12 hours’ incubation.
Abbreviations: FITC, fluorescein isothiocyanate; Ag NPs, silver nanoparticles.
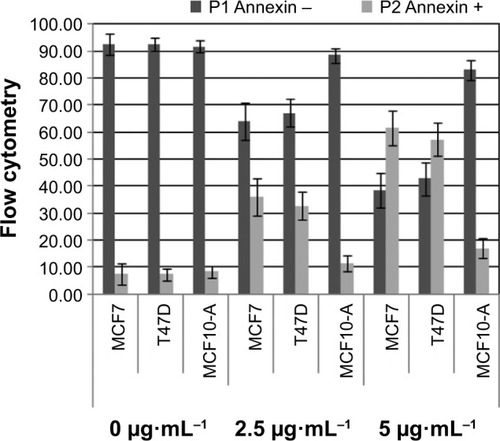
Figure 3 Western-blot quantification of Bcl-2 and caspase-9 by ImageJ software.
Notes: To determine relative intensity values, the maximum value for each protein was assigned as 100%. Caspase-8 and caspase-3/7 activities were assigned by chemiluminescent assay following 6 hours’ incubation with 0, 1, and 2 mg⋅mL−1 Ag NP concentrations.
Abbreviation: Ag NPs, silver nanoparticles.
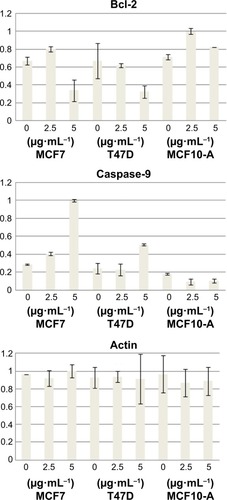
Figure 4 Caspase-8 and caspase-3/7 activities were assigned by chemiluminescent assay following 12 hours’ incubation with 0, and 5 μg⋅mL−1 Ag NP concentrations.
Abbreviation: Ag NPs, silver nanoparticles.
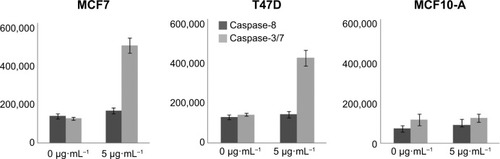
Figure 5 Fluorescent microscopy images of endocytosis assay using FITC-dextran.
Notes: MCF7, T47D, and MCF10-A incubated with FITC-dextran 10.000 kD (0.5 mg⋅mL−1) at 37°C for 0, 4, and 8 hours. Nuclear fluorescence was obtained by DAPI.
Abbreviations: DAPI, 4′,6-diamidino-2-phenylindole; FITC, fluorescein isothiocyanate.
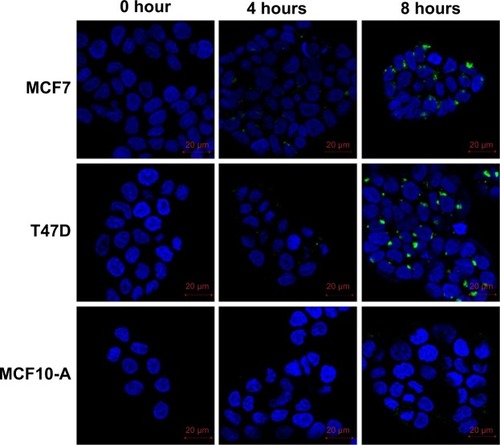
Figure 6 Fluorescent microscopy images to identify Ag NPs and EEA1.
Notes: The colocalization between EEA1 and AgNPs was observed in the confocal analysis. The arrows show the points with colocalization. Nuclear fluorescence was obtained with DAPI. A and B are MCF7 cells; C are T47D cells.
Abbreviations: DAPI, 4′,6-diamidino-2-phenylindole; FITC, fluorescein isothiocyanate; Ag NPs, silver nanoparticles.
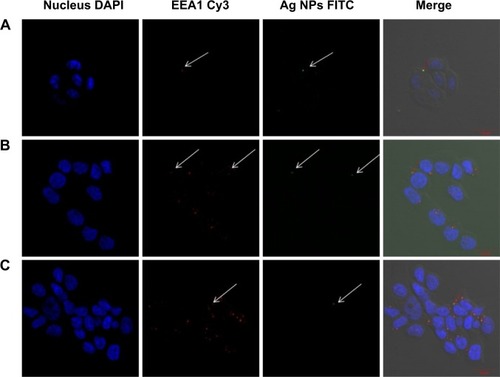
Figure 7 Antiproliferative efficacy of biosynthesized Ag NPs produced by Cryptococcus laurentii at different concentrations after 12 hours.
Notes: MTT assay was used on dynasore treated and non-treated MCF7, T47D, and MCF10-A. All values are expressed as the means of the difference between optical density at 480 and 690 nm ± standard deviation.
Abbreviations: Ag NPs, silver nanoparticles; OD, optical density; MTT, 3-(4,5-dimethylthiazol-2-yl)-2,5-diphenyltetrazolium bromide.
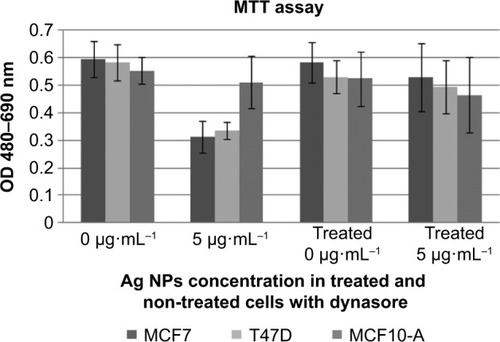
Figure S1 Graphic representation of conjugation reaction between Ag NPs and FITC molecules.
Abbreviations: FITC, fluorescein isothiocyanate; Ag NPs, silver nanoparticles.
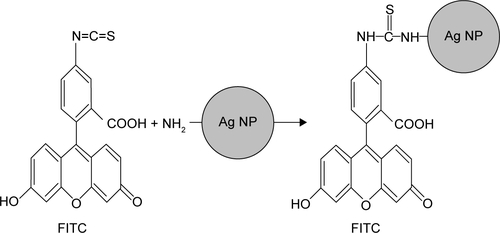
Figure S2 Absorption and emission spectrums of used fluorochromes.
Notes: DAPI: blue; FITC: green; and Alexa Fluor 568: red.
Abbreviations: DAPI, 4′,6-diamidino-2-phenylindole; FITC, fluorescein isothiocyanate.
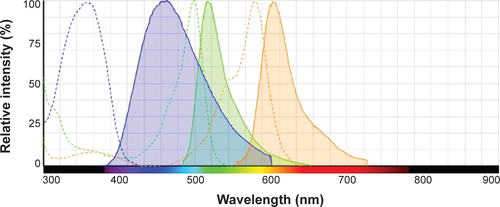
Figure S3 Antiproliferative efficacy of the Ag NPs produced by synthetic methods at different concentrations.
Notes: MTT assay was used on MCF7, T47D, and MCF10-A. All values are expressed as the means of the difference between optical density at 570 and 690 nm ± standard deviation.
Abbreviations: Ag NPs, silver nanoparticles; OD, optical density; MTT, 3-(4,5-dimethylthiazol-2-yl)-2,5-diphenyltetrazolium bromide.
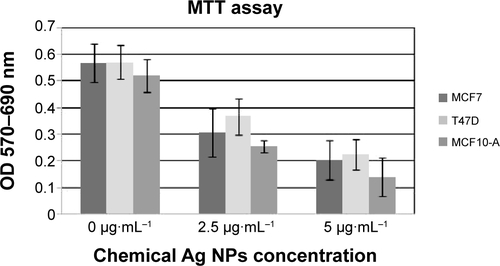
Figure S4 Typical figure of flow cytometry that shows annexin V expression between MCF7, T47D, and MCF10-A cell lines.
Notes: A, B, and C show the dot plot of cytometry analysis, the population 2 (P2) included the single epithelial cells. D, E, and F show the histogram plot of P2 that separates between P3 (positive annexin) and P4 (negative annexin). G, H, and I show the estatistic parameters of the three populations.
Abbreviations: FITC, fluorescein isothiocyanate; FSC-A, forward scatter area; SSC-A, side scatter area.
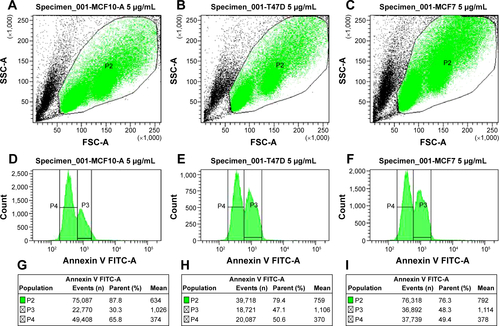
Figure S5 Endocytosis assay using FITC-dextran.
Notes: Fluorescent intensity of cells was measured in eight fields per sample and is presented as mean ± standard deviation.
Abbreviation: FITC, fluorescein isothiocyanate.
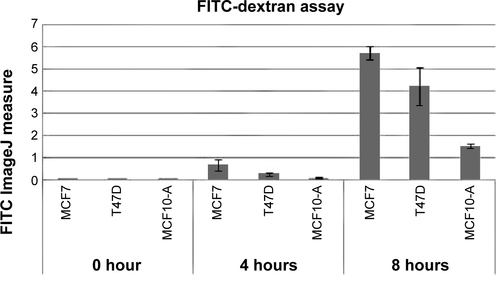
Table S1 Numeric table comparing cell viability of 0, 2.5, and 5 μg⋅mL−1 Ag NPs produced by Cryptococcus laurentii and by synthetic methods
Table S2 Numeric table comparing effect of 0, 2.5, and 5 μg⋅mL−1 of Ag NPs produced by Cryptococcus laurentii after 12 hours’ incubation