
Figures & data
Figure 1 Quantification of Z-GP-Dox by UPLC-QTOF/MS.
Notes: (A) Chemical structure of Z-GP-Dox (N-terminal carbobenzoxy-glycyl-L-proline-4-(Z)-blocked dipeptides derivative of doxorubicin). (B) Representative chromatograms for quantification of Z-GP-Dox by UPLC-QTOF/MS using a 4-minute gradient elution. The bottom panel is the total ion chromatogram (TIC), whereas the top panel is the extracted ion chromatogram (EIC) of Z-GP-Dox.
Abbreviations: Gly, glycine; Pro, proline; UPLC, ultraperformance liquid chromatography; QTOF, quadrupole time-of-flight; MS, mass spectrometry; FAPα, fibroblast activation protein-α.
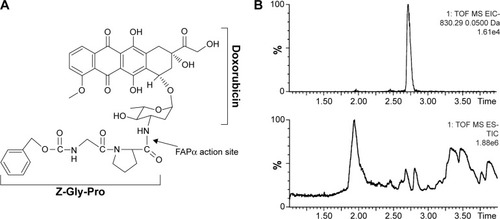
Figure 2 Whole-body PBPK modeling scheme used in this study.
Notes: (A) Whole-body PBPK model consisted of heart (ht), liver (li), spleen (sp), lung (lu), kidney (kd), intestine (in), and remaining tissues (rm). (B) Schematic illustration of the single-tissue model approach.
Abbreviation: PBPK, physiologically-based pharmacokinetic.
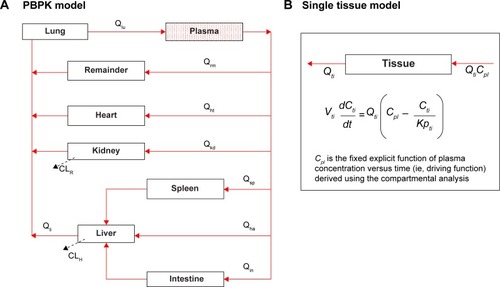
Figure 3 Effects of sodium oleate (A), lecithin (B), drug (C), and water volume upon injection (D) on particle size and drug load of prepared micelles.
Notes: The histogram represents the particle size of the micelles and the line denotes the drug load of the micelles. The data are expressed as the mean ± standard deviation (n=3).
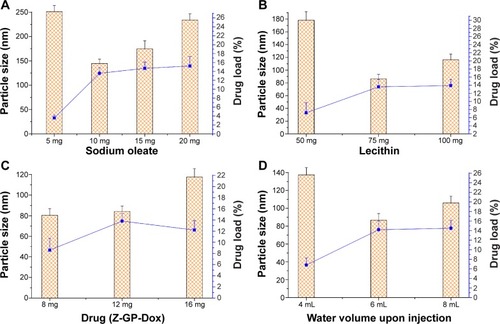
Figure 4 Characterization of Z-GP-Dox-loaded mixed micelles (ZGD-MNs).
Notes: (A) Size measurement of ZGD-MNs. (B) Morphology of ZGD-MNs determined by transmission electron microscopy.
Abbreviation: ZGD-MNs, Z-GP-Dox-loaded mixed nanomicelles; d, diameter; nm, nanometer.
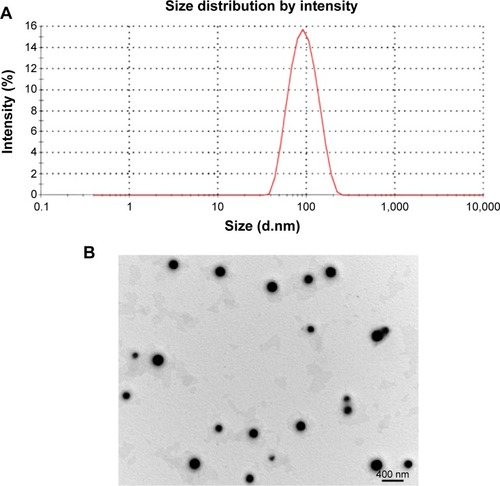
Figure 5 Release curve of Z-GP-Dox from nanomicelles performed based on a dialysis method (n=3, mean ± standard deviation).
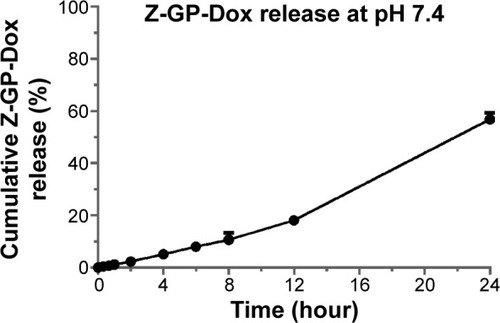
Figure 6 Stability of ZGD-MNs characterized by particle size distribution.
Notes: (A) Short-term (2-week) investigation of storage stability performed under ambient conditions. (B) Blood circulation stability investigation simulated in phosphate-buffered saline (pH 7.2).
Abbreviations: PDI, polydispersity index; ZGD-MNs, Z-GP-Dox-loaded mixed nanomicelles.
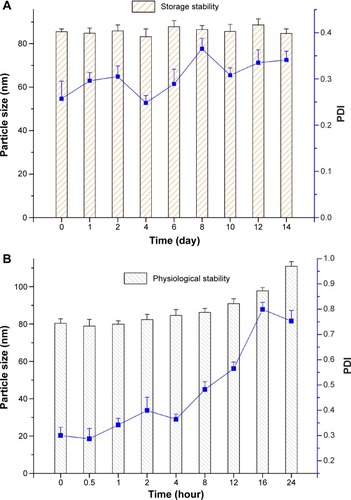
Table 1 List of pharmacokinetic parameters derived by fitting the conventional two-compartment model to the plasma data
Figure 7 Compartmental analyses of plasma concentration-time profiles.
Notes: The plasma data were well described by the conventional two-compartment model. Circles and solid circles are the observed values, whereas the solid red line and blue dashed line are data predicted from the two-compartment model.
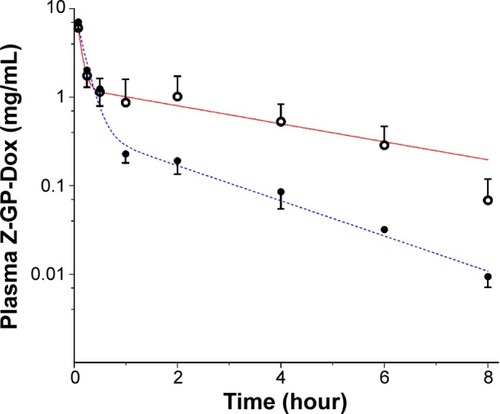
Figure 8 Physiologically-based pharmacokinetic modeling of Z-GP-Dox disposition following administration of cosolvent or micelles (10 mg/kg).
Notes: (A) Heart concentrations in control and micelles treated rats. (B) Lung concentrations in control and micelles treated rats. (C) Kidney concentrations in control and micelles treated rats. (D) Spleen concentrations in control and micelles treated rats. (E) Liver concentrations in control and micelles treated rats. (F) Intestine concentrations in control and micelles treated rats. Circles and solid circles are observed values, whereas the solid red line and blue dashed line are predicted data from the PBPK model.
Abbreviation: PBPK, physiologically-based pharmacokinetic modeling.
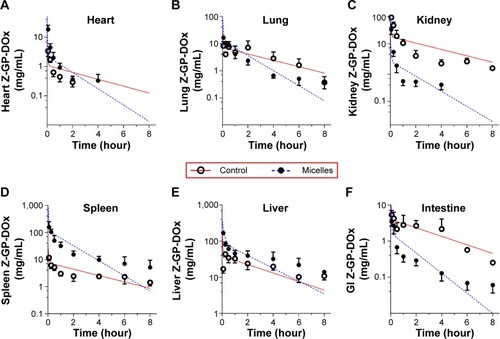
Table 2 List of pharmacokinetic parameters derived by fitting PBPK model to the data