Figures & data
Figure 1 Relationship between F98luc cell number and bioluminescent intensity (n=3).
Notes: (A) In vitro monitoring of bioluminescence of F98luc cells via BLI. (B) In vitro cell growth curve of F98luc cells. (C) Linear correlation between mean cell number and mean bioluminescent intensity (R2=0.99).
Abbreviations: BLI, bioluminescent imaging; Td, doubling time; h, hours.
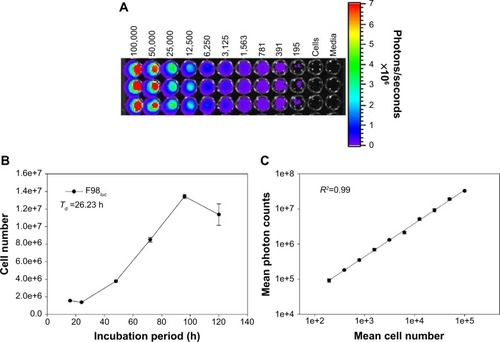
Figure 2 The Fischer344/F98luc rat tumor growth curve as a function of bioluminescent intensity versus time (n=3).
Notes: (A) Non-invasive in vivo monitoring of tumor growth via BLI; (B) quantitative analysis of tumor growth with bioluminescent intensity; (C) the histopathological examination (H and E staining; photo with 40× magnification) of tumor parenchyma at Day 13 post-inoculation.
Abbreviations: BLI, bioluminescent imaging; H and E, hematoxylin and eosin; d, days.
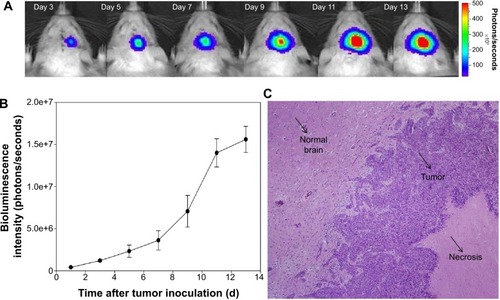
Figure 3 The graphical representation of body weight monitoring of rats (n=5).
Notes: Normal Fischer344 rats administered 296 (▼), 333 (○), and 370 (•) MBq 188Re-liposome via single intravenous injection.
Abbreviation: d, days.
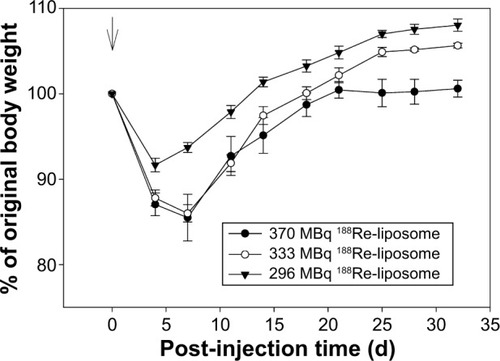
Table 1 Equivalent dose of 188Re-liposome in human organs estimated from extrapolation of orthotopic glioma-bearing rat modelTable Footnote*
Table 2 Therapeutic efficacy evaluation of 333 MBq 188Re-liposome in orthotopic glioma-bearing rat model
Figure 4 The Kaplan–Meier survival curves of Fischer344/F98luc orthotopic glioma bearing rat model n=7.
Notes: Single intravenous injection of normal saline (•) or 333 MBq 188Re-liposome (¡) was performed on Day 7 post-inoculation as marked by an arrow.
Abbreviation: d, days.
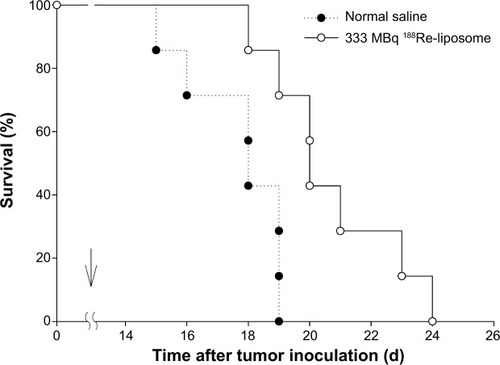
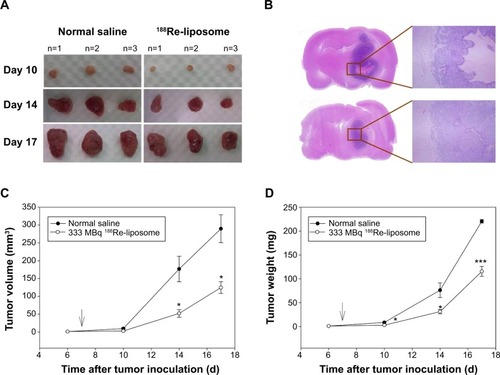
Figure 5 Tumor growth inhibition monitoring at Day 10, 14, and 17 after treatment with normal saline and 188Re-liposome, respectively (n=3).
Notes: (A) Photograph of excised tumor masses after treatment with normal saline (left) and 188Re-liposome (right). (B) Histological examination of H and E staining for tumor parenchyma at Day 14 post-treatment with normal saline (upper) and 188Re-liposome (bottom). (C) Tumor volume (mmCitation3) growth curve after treatment with normal saline (•) and 188Re-liposome (○). (D) Tumor weight (mg) growth curve after treatment with normal saline (•) and 188Re-liposome (○). * and *** indicating the significant differences with P<0.05 and P<0.001 between treated group and control group, respectively.
Abbreviations: d, days; H and E, hematoxylin and eosin.