Figures & data
Figure 1 SEM micrographs, TEM images and EDS spectrum of Ti plates with hydrothermal treatment at different temperatures.
Notes: SEM micrographs (A) Untreated Ti. (B) Ti100. (C) Ti140. (D) Ti150. (E) TEM images of the nanotubes obtained from hydrothermal treatment at 150°C for 3 hours (Ti150). (F) EDS spectrum of the hydrothermally treated samples.
Abbreviations: SEM, scanning electron microscopy; TEM, transmission electron microscopy; EDS, energy dispersion spectroscopy.
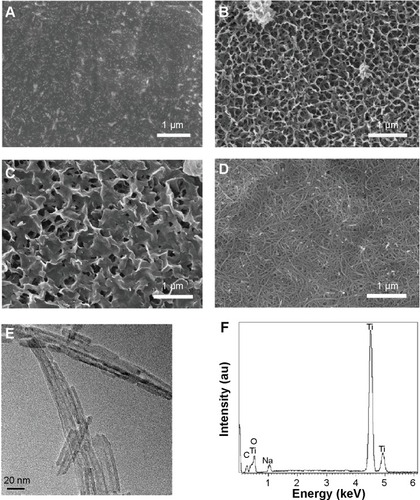
Figure 2 XRD spectra of samples with hydrothermal treatment at different temperatures.
Notes: (a) Untreated Ti. (b) Ti100. (c) Ti140. (d) Ti150.
Abbreviations: N, Na2Ti3O7; XRD, X-ray diffraction.
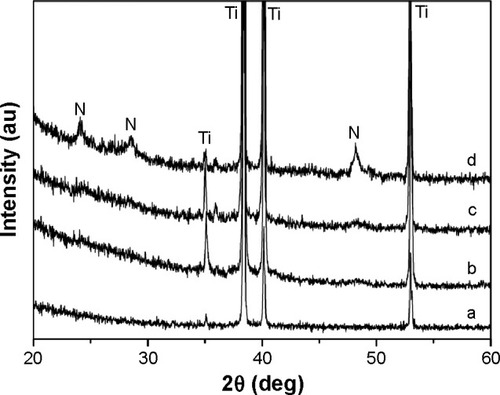
Figure 3 Raman spectra of the samples with hydrothermal treatment at different temperatures.
Notes: (a) Untreated Ti. (b) Ti100. (c) Ti140. (d) Ti150.
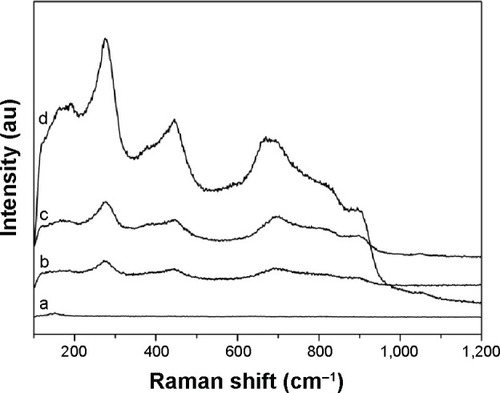
Figure 4 Water contact angles of the samples with hydrothermal treatment at different temperatures.
Notes: (a) Untreated Ti. (b) Ti100. (c) Ti140. (d) Ti150.
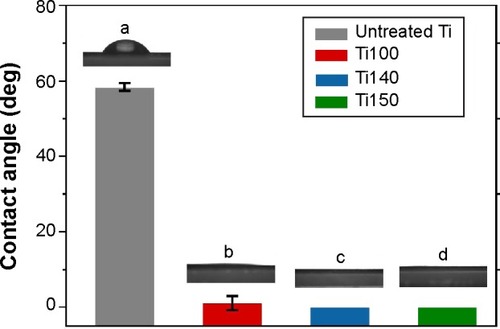
Figure 5 SEM micrographs of the various samples after soaking in SBF for 7 days.
Notes: (A) Untreated Ti. (B) Ti100. (C) Ti140. (D) Ti150.
Abbreviations: SEM, scanning electron microscopy; SBF, simulated body fluid.
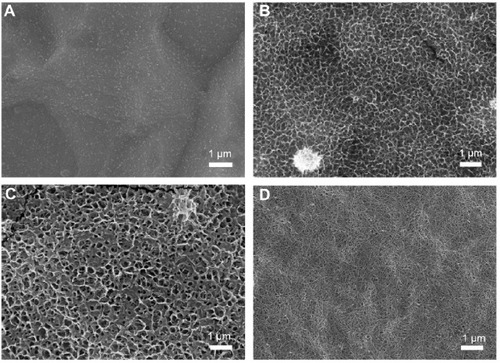
Figure 6 SEM micrographs of the various samples after soaking in SBF for 14 days.
Notes: (A) Untreated Ti. (B) Ti100. (C) Ti140. (D) Ti150.
Abbreviations: SEM, scanning electron microscopy; SBF, simulated body fluid.
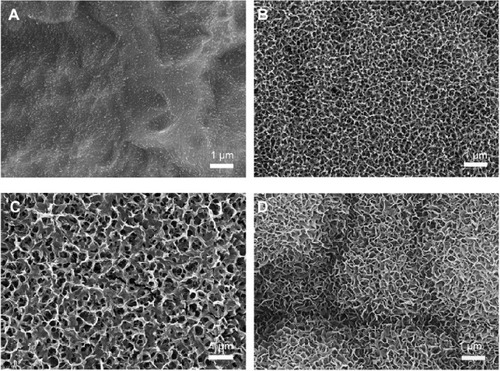
Figure 7 EDS spectrum (A) and FTIR spectrum (B) of the newly formed layer on the Ti150 after soaking for 14 days.
Abbreviations: EDS, energy dispersion spectroscopy; FTIR, Fourier transform infrared spectroscopy.
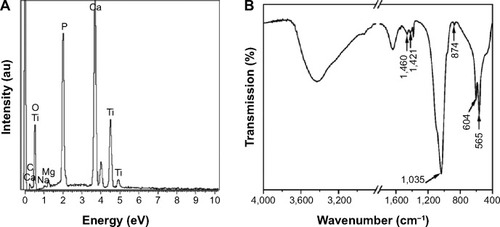
Figure 8 Raman spectra of the various samples after soaking in SBF for (A) 7 days and (B) 14 days.
Notes: (a) Untreated Ti. (b) Ti100. (c) Ti140. (d) Ti150.
Abbreviation: SBF, simulated body fluid.
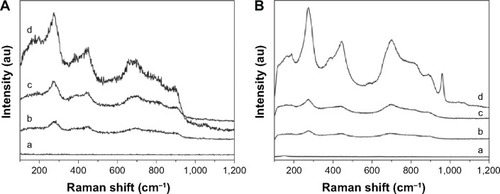
Figure 9 Preosteoblast MC3T3 cell proliferation on untreated Ti, Ti100, Ti140, and Ti150 for 1 day, 3 days, and 7 days.
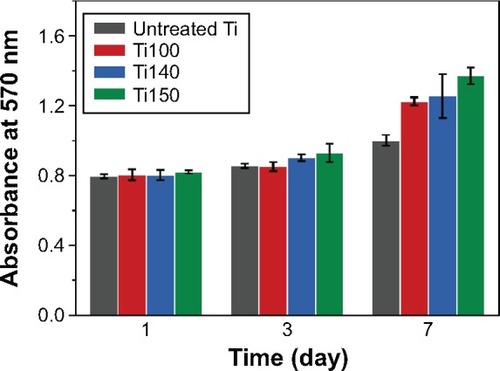
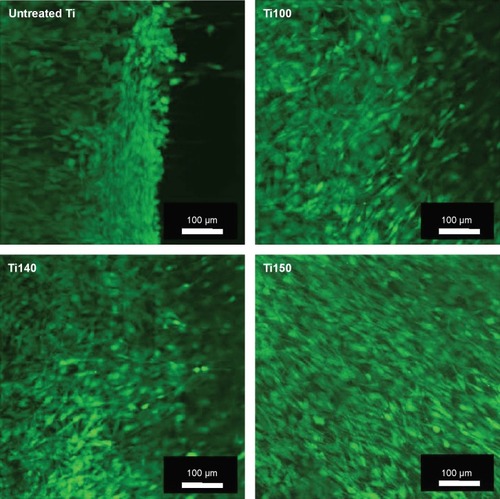
Figure 10 Laser confocal micrographs of preosteoblast MC3T3 cells incubated on untreated Ti, Ti100, Ti140, and Ti150 stained with FDA molecular probe for 3 days.
Abbreviation: FDA, fluorescein diacetate.