Figures & data
Figure 1 Chemical structures of CIT and IT.
Abbreviation: CIT, circinal–icaritin.
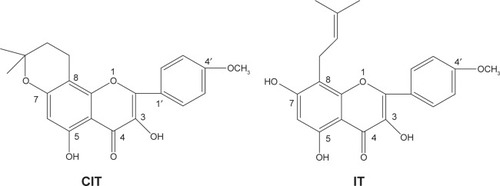
Table 1 BMD and other parameters of trabecular bone structures
Figure 2 Representative micro-computed tomography images of trabecular bone microarchitecture in the distal femurs.
Notes: The OVX rats presented notable reductions in trabecular number and trabecular area compared with the sham rats. CIT, CIT-SO, and EV partially prevented OVX-induced trabecular bone loss and significantly improved trabecular bone mass and microarchitecture. CIT-SO significantly improved trabecular bone microarchitecture compared with CIT.
Abbreviations: OVX, ovariectomized; SO, suet oil; EV, estradiol valerate; CIT, circinal–icaritin; H, high dosage; M, medium dosage; L, low dosage.
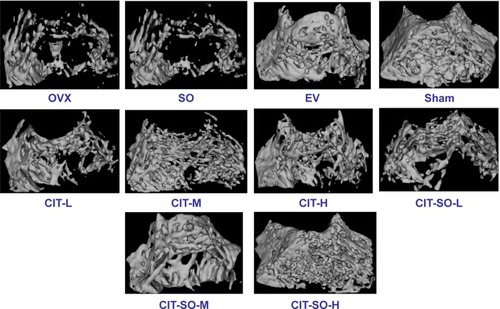
Table 2 Bone biomechanical parameters by mechanical testing
Figure 3 Serum parameters changes in the OVX model of osteoporosis.
Notes: aP<0.05 compared to OVX; bP<0.01 compared to OVX; cP<0.05 compared to CIT-L; dP<0.01 compared to CIT-L; eP<0.05 compared to CIT-M; fP<0.01 compared to CIT-M; gP<0.05 compared to CIT-H; hP<0.01 compared to CIT-H.
Abbreviations: OVX, ovariectomized; SO, suet oil; EV, estradiol valerate; CIT, circinal–icaritin; H, high dosage; M, medium dosage; L, low dosage; HOP, hydroxyproline; ALP, alkaline phosphatase; OPG, osteoprotegerin; OCN, osteocalcin; RANKL, receptor activator of nuclear factor-κB ligand; TRACP-5b, tartrate-resistant acid phosphatase 5b.
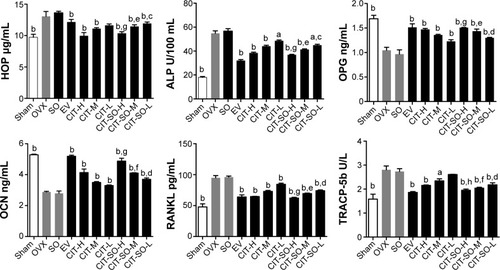
Figure 4 Related protein and gene expressions in osteoporotic rat femurs.
Notes: (A) OPG and RANKL protein expressions in femurs of OVX rats. Effects of 12-week treatment with EV, CIT-H, CIT-M, CIT-L, CIT-SO-H, CIT-SO-M, and CIT-SO-L on protein expressions of OPG and RANKL. (B) OPG and RANKL mRNA expressions in femur of OVX rats treated with EV, CIT-H, CIT-M, CIT-L, CIT-SO-H, CIT-SO-M, and CIT-SO-L for 12 weeks. Total RNA was isolated, and reverse-transcription polymerase chain reaction was performed to determine OPG and RANKL mRNA expressions. Values are expressed as means ± standard deviation (n=8); aP<0.05 compared to OVX, bP<0.01 compared to OVX, cP<0.05 compared to CIT-L, dP<0.05 compared to CIT-M, eP<0.05 compared to CIT-H, fP<0.01 compared to CIT-H.
Abbreviations: OVX, ovariectomized; SO, suet oil; EV, estradiol valerate; CIT, circinal–icaritin; H, high dosage; M, medium dosage; L, low dosage; RANKL, receptor activator of nuclear factor-κB ligand; OPG, osteoprotegerin; mRNA, messenger ribonucleic acid; OCN, osteocalcin; GAPDH, glyceraldehyde 3-phosphate dehydrogenase.
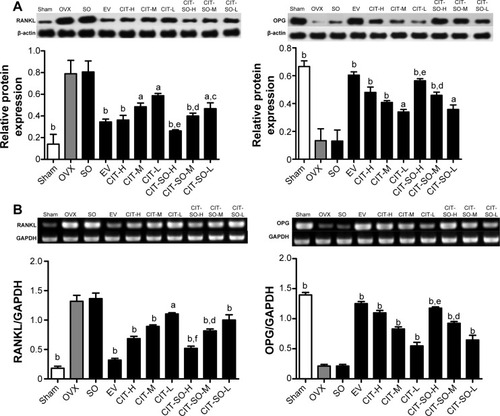
Table 3 Pharmacokinetic parameters of CIT and CIT-SO administered orally to rats (n=3)
Figure 5 The plasma concentration–time curve of CIT in rats after oral administration of CIT and CIT-SO.
Notes: Dosage 40 mg/kg for CIT-H and CIT-SO-H, 20 mg/kg for CIT-M and CIT-SO-M, and 10 mg/kg for CIT-L and CIT-SO-L.
Abbreviations: CIT, circinal–icaritin; SO, suet oil; H, high dosage; M, medium dosage; L, low dosage.
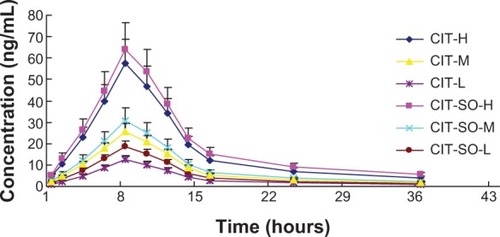
Table 4 Physicochemical properties of CIT with or without SO
Figure 6 Particle-size distribution and transmission electron microscopy of CIT-DOC and IT-SO-DOC.
Notes: (A) Particle-size distribution of CIT-DOC; (B) particle-size distribution of CIT-SO-DOC; (C) transmission electron microscopy of CIT-DOC; (D) transmission electron microscopy of CIT-SO-DOC. The average size of CIT-SO-DOC micelle was 100.80±7.21 nm, which was significantly lower than the 204.77±6.81 nm of the CIT-DOC group. The CIT-SO-DOC self-assembled nanomicelles seemed to be monodisperse spherical particles with smooth surfaces.
Abbreviations: CIT, circinal–icaritin; DOC, sodium deoxycholate; SO, suet oil.
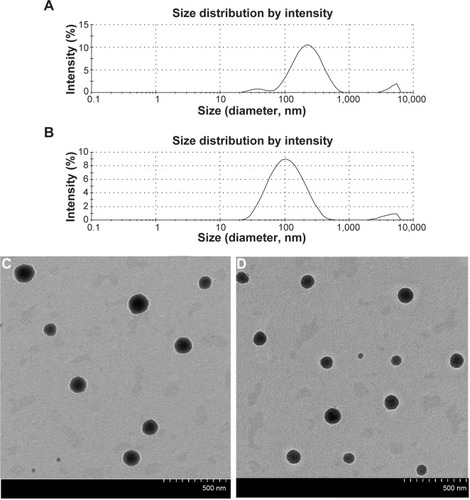
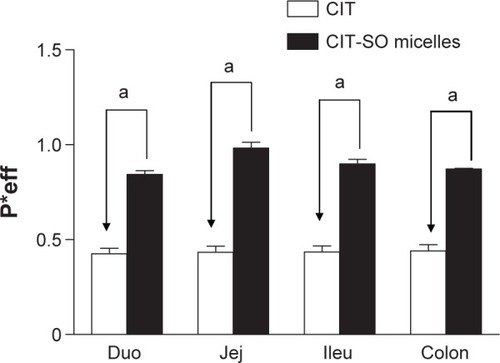
Figure 7 The permeability-coefficient (P*eff) values of CIT and CIT-SO in the duodenum (Duo), jejunum (Jej), ileum (Ileu), and colon.
Notes: aP<0.01 compared with CIT-DOC group. Data expressed as means ± standard deviation (n=4).
Abbreviations: CIT, circinal–icaritin; SO, suet oil.