Figures & data
Figure 1 Dye/silica synthetic pathway.
Notes: Positively charged dye molecules electrostatically bind to commercial silica cores and are exposed to tetraethyl orthosilicate and arginine to form silica shells.
Abbreviations: R, Rhodamine; SiO2, silicon dioxide; TEOS, tet raethyl orthosilicate.
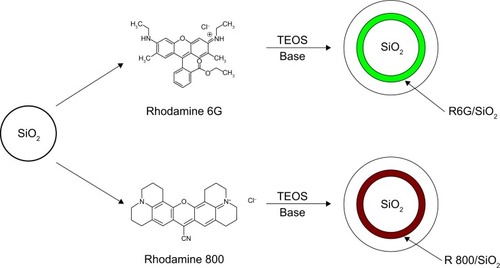
Figure 2 Quantum dots/silica synthetic pathway.
Notes: Arginine-driven synthesis. Quantum dots are reacted with tetraethyl orthosilicate and arginine without the addition of an emulsion. Arrows indicate individual quantum dots in TEM image. TEM inset shows a single CdSe/CdS/ZnS quantum dot particle.
Abbreviations: SiO2, silicon dioxide; TEM, transmission electron microscopy; TEOS, tet raethyl orthosilicate; QD, quantum dots.
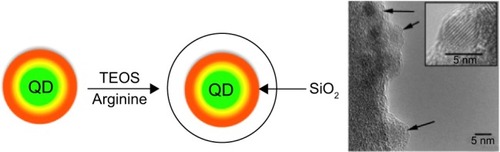
Figure 3 TEM images and fluorescent properties of dye/silica particles.
Notes: (A) Transmission electron microscopy images of initial core silica nanoparticles; typical diameter ranges from 20 to 30 nm. (B–E) Arginine-driven silica coating of core silica nanoparticles shown in (A). (B) Transmission electron microscopy images of Rhodamine 800/silica particles, 32±15 nm in diameter (n=54). (C) Fluorescence spectra of particles after 1 week in phosphate-buffered saline (black) and supernatant after phosphate-buffered saline incubation (red), indicating no leakage of dye. (D) Transmission electron microscopy images of Rhodamine 6G/silica particles, 28±11 nm (n=55). (E) Fluorescence spectra of particles after 1 week in phosphate-buffered saline (black) and supernatant after phosphate-buffered saline incubation (red), indicating no leakage of dye.
Abbreviation: R, Rhodamine.
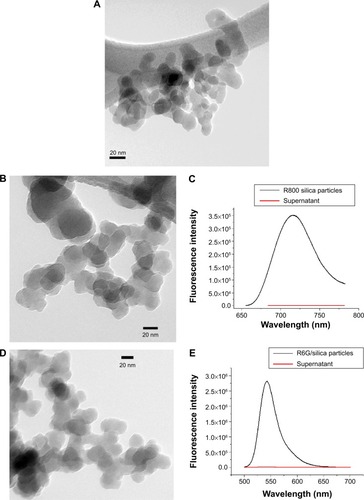
Figure 4 Representative transmission electron microscopy images of arginine quantum dots/silica particles synthesized for 48 hours.
Notes: (A) 9.38×10⁻⁴ M; (B) 2.81×10⁻³ M; (C) 5.63×10⁻³ M; and (D) 1.13×10⁻² M arginine. Primary particle sizes measured to be (A) 22±3 nm; (B) 29±6 nm; (C) 29±5 nm; and (D) 31±8 nm.
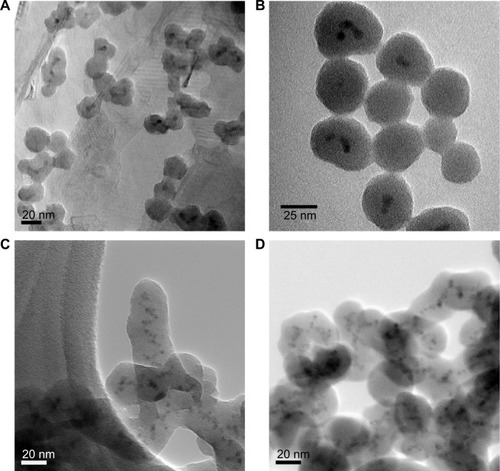
Table 1 Summary of quantum yield and particle size measurements of arginine quantum dots/silica particles synthesized with varying concentrations of arginine
Figure 5 Fluorescence quenching of silica-coated quantum dots prepared by arginine silica synthesis after 0 and 7 days in phosphate-buffered saline.
Notes: No quenching is observed. λex=375 nm.
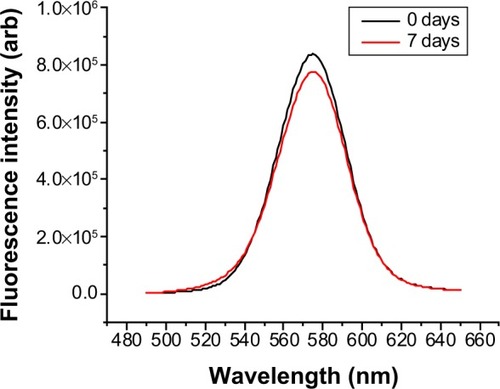
Figure 6 Zeta potential titration of silica cores, Rhodamine 6G/Silica, Rhodamine 800/Silica, and quantum dots/silica.
Notes: Similar values for all three indicate that dye particles are completely encapsulated within a silica shell. IEP values were 1.91 for commercial silica, 1.34 for Rhodamine 6G/silica, and 1.70 for Rhodamine 800/silica. Quantum dots/silica did not cross the IEP.
Abbreviations: SiO2, silicon dioxide; QD, quantum dots; R, Rhodamine; IEP, isoelectric point.
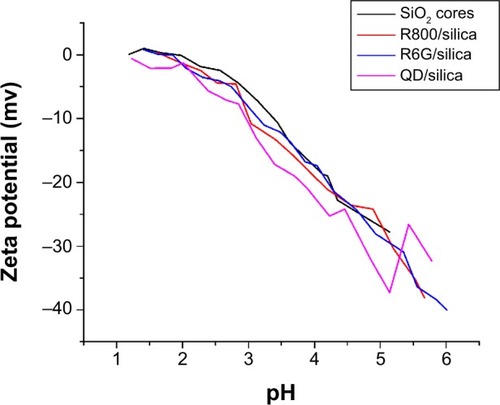
Figure 7 Optical spectra.
Notes: Ultraviolet/visible absorption spectra of (A) Rhodamine 6G, (C) Rhodamine 800, and (E) quantum dots before and after silica coating. Fluorescence spectra of (B) Rhodamine 6G (λex=480), (D) Rhodamine 800 (λex=635), and (F) quantum dots (λex=375) before and after silica coating.
Abbreviations: R, rhodamine; QD, quantum dots.
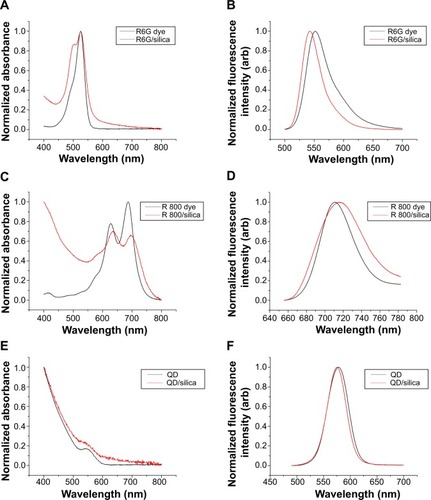
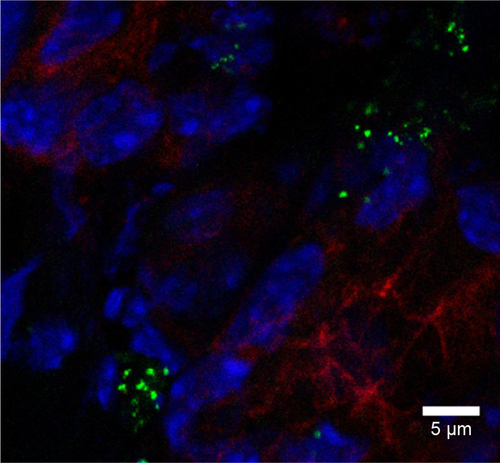
Figure 8 Rhodamine 6G/silica particles in mouse tissue.
Notes: Confocal microscopy of frozen tissue sections is shown: (A) stomach, (B) kidney, (C) lung, (D) brain, and (E) spleen. Mice were administered optimized Rhodamine 6G/silica particles orally every 24 hours for 4 days, and organs were harvested 3 hours after the final administration. Sections were stained with 4′,6′-diamidino-2-phenylindole (cell nuclei; blue) and E-cadherin (junctions between epithelial cells; red). Brain tissue (D) was stained with GFAP (expressed by many cells of the central nervous system; red) instead of E-cadherin. Rhodamine 6G/silica particles are green.
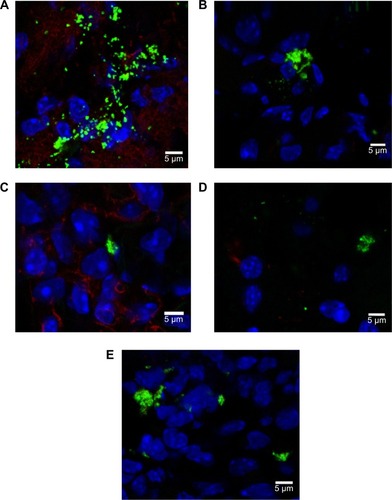
Figure 9 Confocal fluorescent microscopy and elemental analysis of QD/silica particles in liver tissue.
Notes: (A) Quantum dots/silica particles in liver tissue section. Mice were administered quantum dots/silica particles orally every 24 hours for 4 days, and organs were harvested 3 hours after the final administration. Confocal microscopy of frozen liver tissue section is shown. Sections were stained with 4′,6′-diamidino-2-phenylindole (cell nuclei; blue) and E-cadherin (junctions between epithelial cells; red). Quantum dots/silica particles are green. (B) Inductively coupled plasma mass spectrometry measurements of Cd and Si concentration from a solution of quantum dots/silica particles (black) and from a liver tissue sample (red). Si was measured at a resolving power (R=m/Δm) of 300, whereas Cd was measured at a resolving power of 4,000.
Abbreviation: QD, quantum dots.
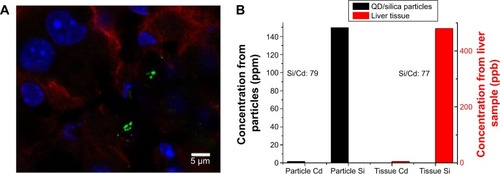
Figure 10 Potential pathways of quantum dots silica coating.
Notes: (A) Low concentration of arginine, silanol groups do not cross-link between quantum dots. (B) High concentration of arginine, silanol groups cross-link, leading to quantum dots bound together within a silica shell.
Abbreviation: TEOS, tet raethyl orthosilicate.
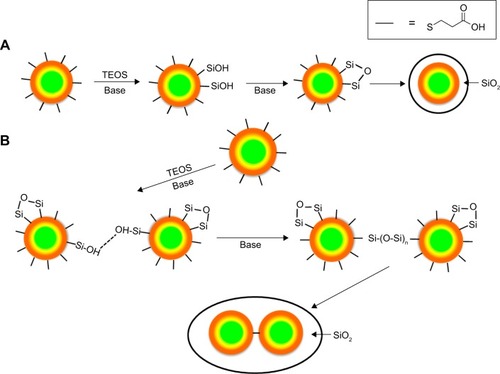
Figure S1 Dye concentration optimization for Rhodamine 800/silica particles.
Notes: These particles were not sufficiently luminescent for quantum yield analysis in the Quanta-Phi system. As-synthesized samples were observed with 10:1 dilution. λex=635 nm.
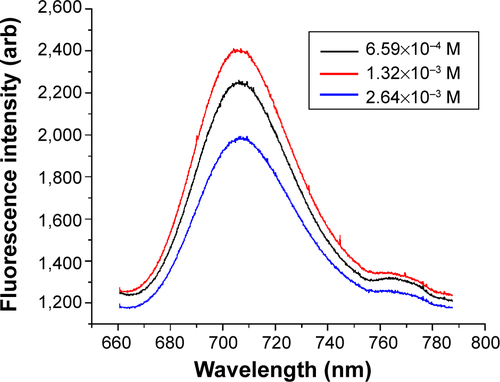
Figure S2 Tetraethyl orthosilicate concentration optimization for Rhodamine 800/silica particles.
Notes: These particles were not sufficiently luminescent for quantum yield analysis in the Quanta-Phi system. As-synthesized samples were observed with 10:1 dilution. λex=635 nm.
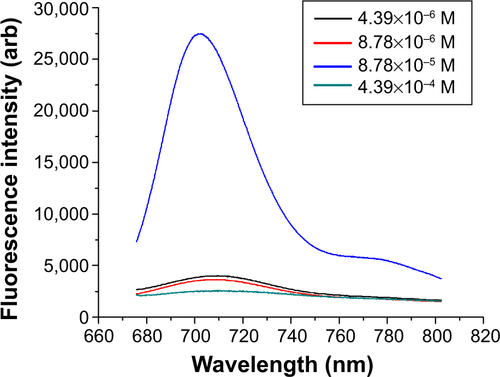
Figure S3 Infrared and 29Si nuclear magnetic resonance spectroscopy of Arginine driven R6G and QD/silica.
Notes: (A) Diffuse reflectance infrared Fourier transform spectroscopy spectra of silica-coated quantum dots and Rhodamine 6G driven by arginine, focusing on ∼800 cm−1 framework peak and ∼960 cm−1 silanol peak. Samples were lyophilized and vacuum dried at 110°C for at least 12 hours and then diluted to approximately 1% by weight/KBr. Sample runs set to continue for 20 minutes from 600 to 4,500 cm−1 with 2 cm−1 resolution. (B) 29Si nuclear magnetic resonance spectra of silica-coated quantum dots and Rhodamine 6G driven by arginine. Q4, Q3, and Q2 peaks are labeled. Samples were run with the same preparation as the diffuse reflectance infrared Fourier transform spectroscopy experiment. 29Si chemical shifts were referenced to TMS (δ 29Si=0 ppm). The 29Si nuclear magnetic resonance spectra of the samples were obtained using a Bruker two-channel probe in a 4 mm rotor spun at 5 kHz. All spectra were carried out with a proton-to-silicon cross-polarization time of 5 milliseconds, a relaxation delay of 5 seconds, and ∼100 kHz proton decoupling.
Abbreviations: R, Rhodamine; QD, quantum dots; KBr, potassium bromide.
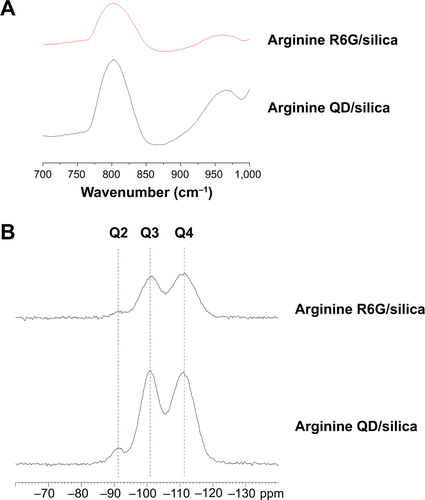
Figure S4 Diffuse reflectance infrared Fourier transform spectroscopy spectra of silica-coated (A) quantum dots and (B) Rhodamine 6G driven by arginine, showing full spectrum.
Notes: Samples were lyophilized and vacuum dried at 110°C for at least 12 hours and then diluted to approximately 1% by weight/KBr. Sample runs set to continue for 20 minutes from 600 to 4,500 cm−1, with 2 cm−1 resolution.
Abbreviations: R, Rhodamine; QD, quantum dots; TO, transverse optical; LO, longitudinal optical.
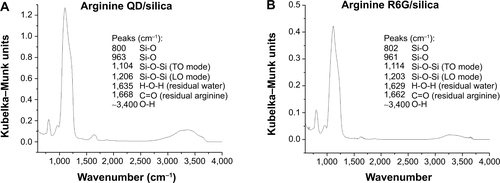
Figure S5 Quantum dot/silica and rhodamine 6G/silica particles in murine macrophages.
Notes: Murine macrophage cells were grown to confluence in an eight-chamber slide and treated for 24 hours with a 100 μg/cm2 dose of (A) quantum dot/silica and (B) Rhodamine 6G/silica particles. Cells were fixed in 4% paraformaldehyde and stained with 4′,6′-diamidino-2-phenylindole (blue; cell nuclei) and E-cadherin (red; junctions between cells) and were analyzed by confocal fluorescence microscopy. Both particles are shown in green.
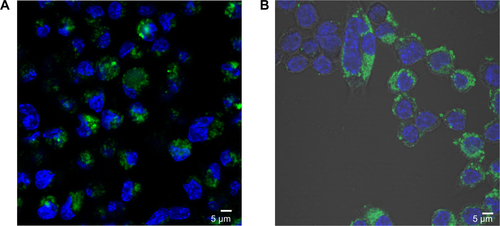
Figure S6 Quantum dot/silica and rhodamine 6G silica particles in C2BBe1 cells.
Notes: The intestinal epithelial cells C2BBe1 were grown to confluence in an eight-chamber slide and treated for 24 hours with a 100 μg/cm2 dose of (A) quantum dot/silica and (B) rhodamine 6G/silica particles. Cells were fixed in 4% paraformaldehyde and stained with 4′,6′-diamidino-2-phenylindole (blue; cell nuclei) and E-cadherin (red; junctions between cells) and analyzed by confocal fluorescence microscopy. Both particles are shown in green.
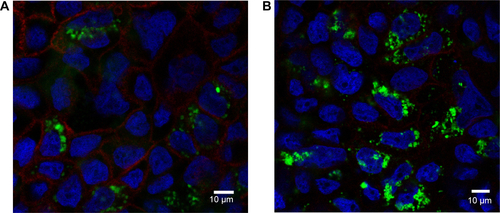
Figure S7 Rhodamine 6G/silica particles in small intestine tissue.
Notes: Mice were administered optimized Rhodamine 6G/silica particles orally every 24 hours for 4 days, and organs were harvested 3 hours after the final administration. Confocal microscopy of frozen small intestine tissue section is shown. Section was stained with 4′,6′-diamidino-2-phenylindole (cell nuclei; blue) and E-cadherin (junctions between epithelial cells; red). Rhodamine 6G/silica particles are green.
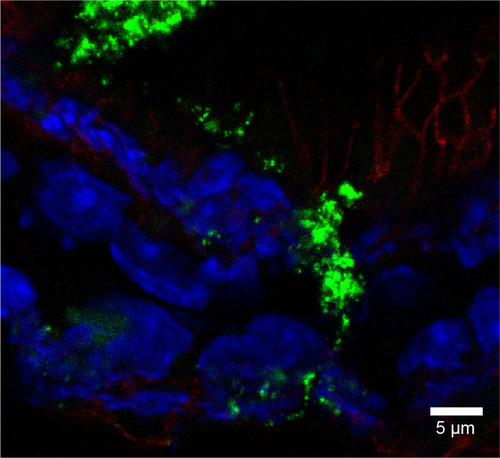
Figure S8 Rhodamine 6G/silica particles in cecum tissue.
Notes: Mice were administered optimized Rhodamine 6G/silica particles orally every 24 hours for 4 days, and organs were harvested 3 hours after the final administration. Confocal microscopy of frozen cecum tissue section is shown. Section was stained with 4′,6′-diamidino-2-phenylindole (cell nuclei; blue) and E-cadherin (junctions between epithelial cells; red). Rhodamine 6G/silica particles are green.
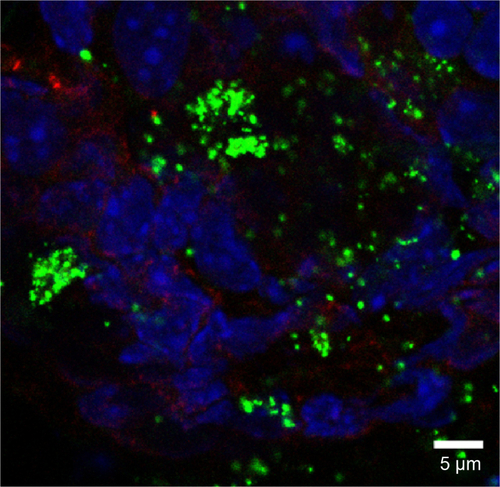
Figure S9 Rhodamine 6G/silica particles in colon tissue.
Notes: Mice were administered optimized Rhodamine 6G/silica particles orally every 24 hours for 4 days, and organs were harvested 3 hours after the final administration. Confocal microscopy of frozen colon tissue section is shown. Section was stained with 4′,6′-diamidino-2-phenylindole (cell nuclei; blue) and E-cadherin (junctions between epithelial cells; red). Rhodamine 6G/silica particles are green.