Figures & data
Table 1 Matrix of experiments for the preparation of microemulsions
Table 2 Summary of the pharmacokinetic parameters for RTQ and MTQ (IV n=5, oral n=4)
Table 3 Drug administration details per group
Table 4 Characteristics of microemulsion formulations
Figure 1 Percentage of TQ (of 5 mg/mL) dissolved in different components of microemulsion and the optimized microemulsion (n=3; mean ± standard deviation).
Abbreviations: PVA, polyvinyl alcohol; TQ, tafenoquine.
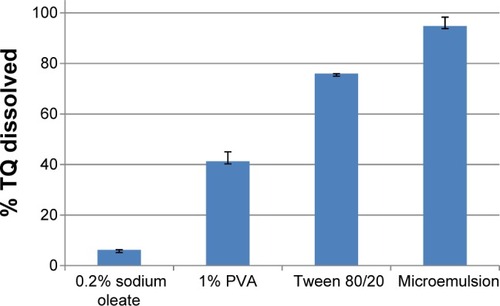
Figure 2 Mean whole blood concentration versus time graphs following oral administration of 20 mg/kg each of tafenoquine reference formulation and microformulation.
Note: Data shown represent mean ± standard error of the mean of n=4 mice.
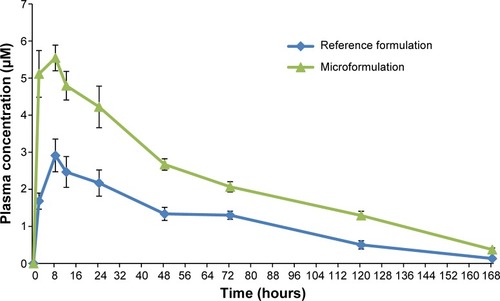
Figure 3 Percentage loss of HuRBCs in SCID mice following oral administration of unformulated TQ and MTQ (n=4).
Abbreviations: HuRBC, human red blood cell; MTQ, microemulsion formulation of TQ; SCID, severe combined immunodeficiency; TQ, tafenoquine.
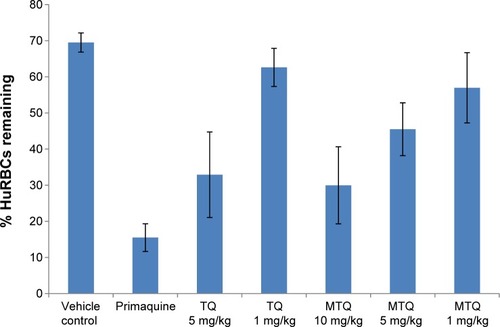
Figure 4 Peripheral blood levels of muRetics on day 7 (n=4).
Abbreviations: MTQ, microemulsion formulation of TQ; muRetics, mouse reticulocytes; TQ, tafenoquine.
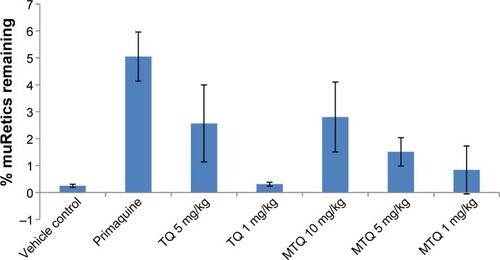
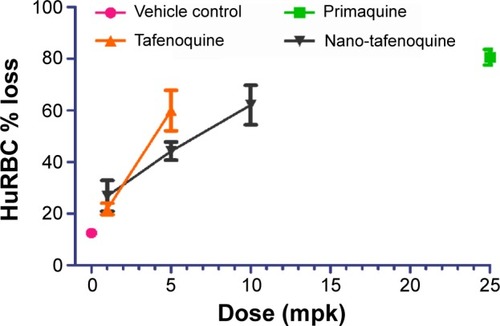
Figure 5 Percentage HuRBC loss (n=4).
Notes: HuRBC % loss was calculated as ((day 0–day 7)/day 0) *100. Nano-tafenoquine = microemulsion formulation of tafenoquine; tafenoquine = unformulated tafenoquine.
Abbreviation: HuRBC, human red blood cell.