Figures & data
Table 1 Characterization of UA-NPs
Figure 1 Characterization of UA-NPs.
Notes: (A) Pictures of deionized water and solutions of UA-NPs. (B) Morphology of UA-NPs determined by SEM and TEM. (C) The FTIR spectra of UA, PVP-b-PCL nanoparticles, and UA-NPs: the characteristic peaks of UA at 1,688 cm−1 can be differentiated from the background of carriers (arrows). (D) Cumulative in vitro release profile of UA from PVP-b-PCL nanoparticles. Data are presented as mean ± SD (n=3).
Abbreviations: FTIR, Fourier transform infrared; SD, standard deviation; SEM, scanning electron microscope; PVP-b-PCL, poly(N-vinylpyrrolidone)-block-poly (ε-caprolactone); TEM, transmission electron microscope; UA, ursolic acid; UA-NPs, UA-loaded PVP-b-PCL nanoparticles.
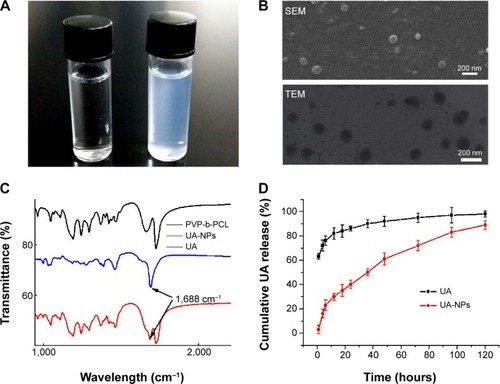
Figure 2 XRD diagrams of UA and UA-NPs.
Abbreviations: NP, nanoparticle; PCL, polycaprolactone; PVP, poly(N-vinylpyrrolidone); UA, ursolic acid; UA-NPs, UA-loaded poly(N-vinylpyrrolidone)-block-poly (ε-caprolactone) nanoparticles; XRD, X-ray diffraction.

Figure 3 DSC thermograms of UA and UA-NPs.
Abbreviations: DSC, differential scanning calorimetry; UA, ursolic acid; UA-NPs, UA-loaded poly(N-vinylpyrrolidone)-block-poly (ε-caprolactone) nanoparticles.
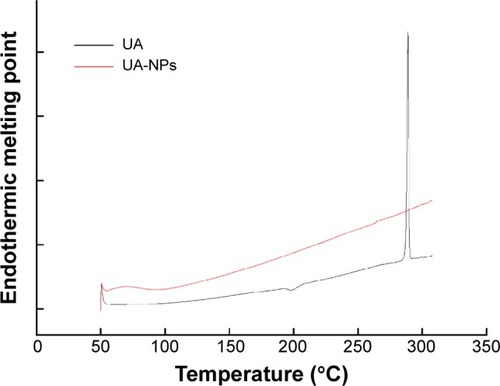
Figure 4 Cytotoxicity of UA and UA-NPs against H22 cells.
Notes: (A) Dose-dependent inhibition profiles of UA and UA-NPs against H22 cells for 48 hours. (B) Cytotoxicity of empty NPs against H22 cells for 48 hours. **P<0.01 versus the equivalent dose of UA. Data are presented as mean ± SD (n=3).
Abbreviations: NP, nanoparticle; SD, standard deviation; UA, ursolic acid; UA-NPs, UA-loaded poly(N-vinylpyrrolidone)-block-poly (ε-caprolactone) nanoparticles.
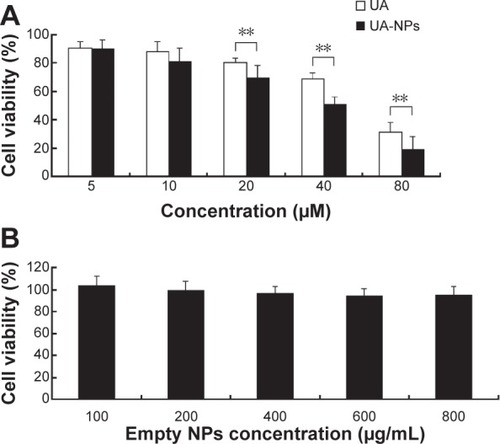
Figure 5 Apoptotic induction in H22 cells treated with equivalent doses of UA or UA-NPs.
Notes: (A) Flow cytometry-based annexin V-FITC/PI labeling of apoptotic cells. (B) The histogram represents apoptosis rates. #P<0.01 versus control group. *P<0.01 versus the group exposed to UA 20 μM. **P<0.01 versus the group exposed to UA 40 μM. Data are presented as mean ± SD (n=3).
Abbreviations: FITC, fluorescein isothiocyanate; PI, propidium iodide; SD, standard deviation; NP, nanoparticle; UA, ursolic acid; UA-NPs, UA-loaded poly(N-vinylpyrrolidone)-block-poly (ε-caprolactone) nanoparticles; A, annexin.
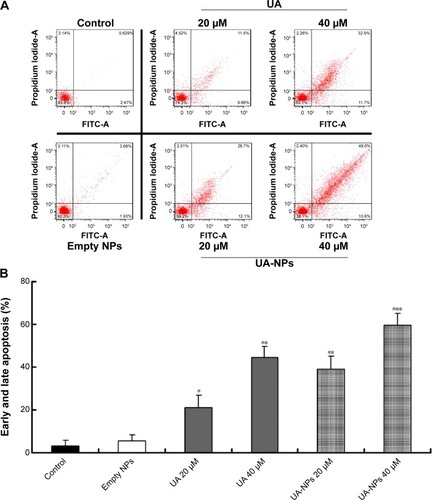
Figure 6 Antitumor effect of UA-NPs in H22 subcutaneous tumor bearing mouse model.
Notes: Changes in (A) tumor volume, (B) relative tumor volume, (C) therapeutic group/control group (T/C)%, and (D) body weight of H22-transplanted imprinting control region mice receiving different therapy treatments. *P<0.05 versus control; **P<0.01 versus control. #P<0.05 versus the equivalent dose of UA. Data in (A) and (D) are presented as mean ± SD.
Abbreviations: SD, standard deviation; NP, nanoparticle; UA, ursolic acid; UA-NPs, UA-loaded poly(N-vinylpyrrolidone)-block-poly (ε-caprolactone) nanoparticles.
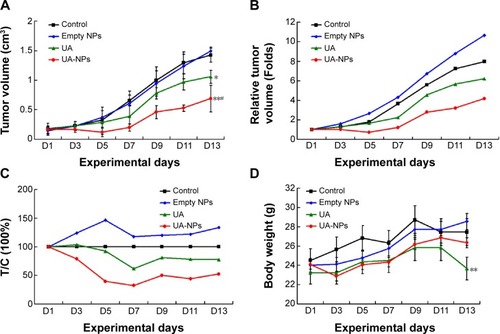
Figure 7 Corresponding CT images of mice post treatment were collected to estimate the therapeutic efficacy.
Notes: (A) Volume rendered three-dimensional reconstruction and (B) transversal sections of mice posttreatment, via different methods.
Abbreviations: CT, computed tomography; NP, nanoparticle; UA, ursolic acid; UA-NPs, UA-loaded poly(N-vinylpyrrolidone)-block-poly (ε-caprolactone) nanoparticles.
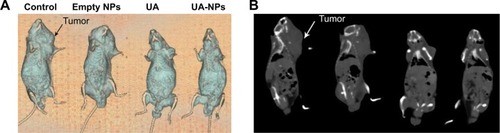
Figure 8 Protein expression of COX-2, Caspase-3, Bax, and Bcl-2 in H22 cells exposed to empty NPs, UA, and UA-NPs.
Notes: (A) The gel image of Western blot analysis. (B) The histogram representing the semiquantification of gel image normalizing the band with the GAPDH control. **P<0.01 versus control. #P<0.05 versus the equivalent dose of UA. Data are presented as mean ± SD (n=3).
Abbreviations: NP, nanoparticle; SD, standard deviation; UA, ursolic acid; UA-NPs, UA-loaded poly(N-vinylpyrrolidone)-block-poly (ε-caprolactone) nanoparticles.
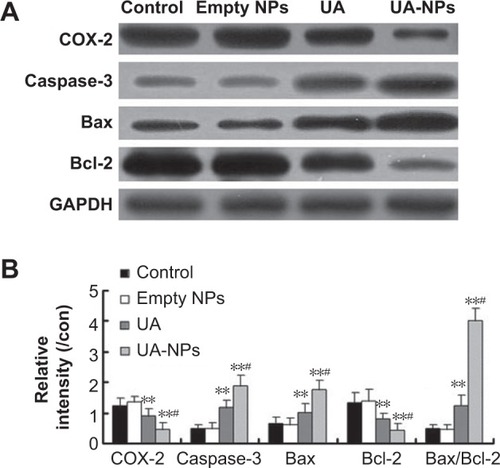
Figure 9 The tumor protein expression of COX-2, Caspase-3, Bax, and Bcl-2 in H22-transplanted mice treated with empty NPs, UA, and UA-NPs.
Notes: (A) The gel image of Western blot analysis. (B) The histogram representing the semiquantification of gel image normalizing the band with the GAPDH control. **P<0.01 versus control. #P<0.05 versus the equivalent dose of UA. Data are presented as mean ± SD (n=3).
Abbreviations: NP, nanoparticle; SD, standard deviation; UA, ursolic acid; UA-NPs, UA-loaded poly(N-vinylpyrrolidone)-block-poly (ε-caprolactone) nanoparticles.
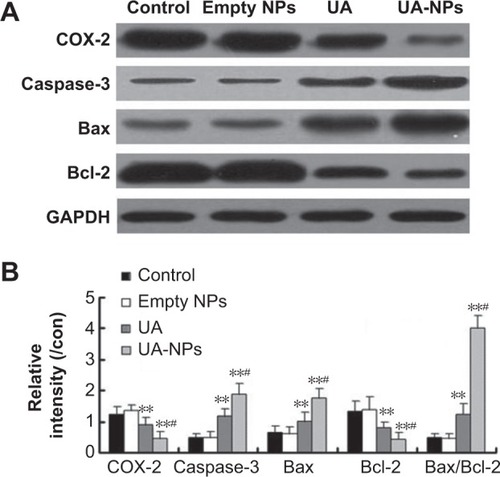
Figure 10 The expressions of COX-2, Caspase-3, Bax, and Bcl-2 proteins in the empty NPs, UA, and UA-NPs groups were determined by immunohistochemical and observed under a microscope (×200).
Abbreviations: NP, nanoparticle; UA, ursolic acid; UA-NPs, UA-loaded poly(N-vinylpyrrolidone)-block-poly (ε-caprolactone) nanoparticles.
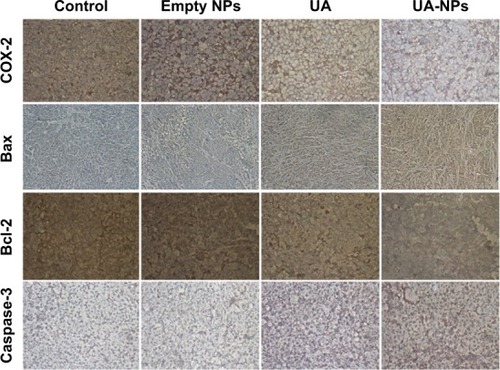
Figure 11 In vivo biodistribution after intraperitoneal administration of (A) UA and (B) UA-NPs in mice.
Abbreviations: UA, ursolic acid; UA-NPs, UA-loaded poly(N-vinylpyrrolidone)-block-poly (ε-caprolactone) nanoparticles.
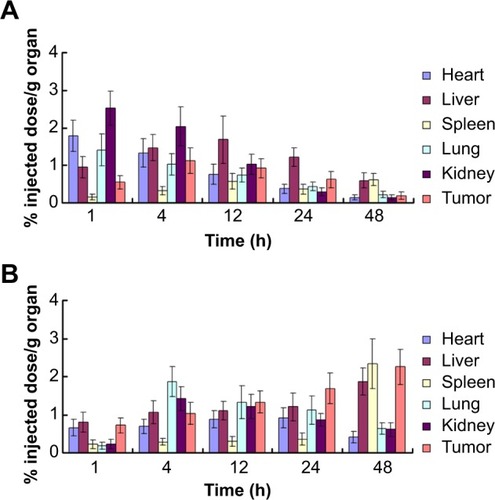
Figure S1 Bar graph of the size of nanoparticles.
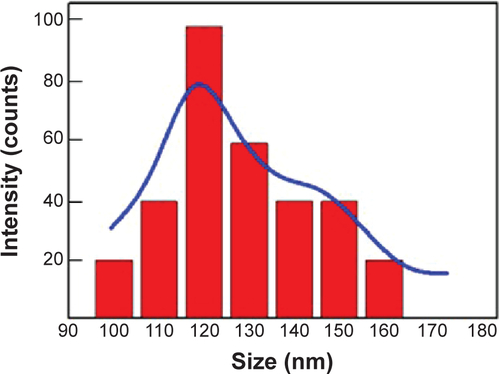
Figure S2 Fluorescent intensity of FITC detected by FACS.
Abbreviations: NP, nanoparticle; FITC, fluorescein isothiocyanate; FACS, fluorescence-activated cell sorting.
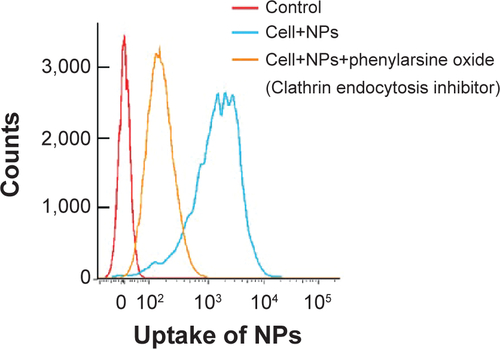
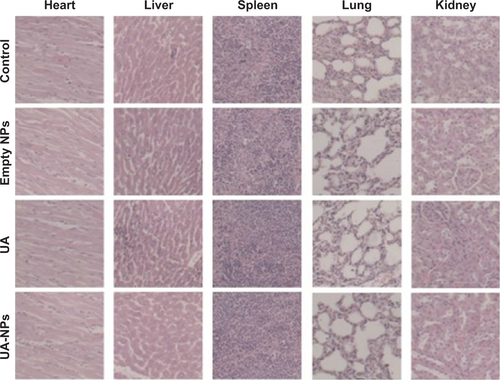
Figure S3 H&E staining of different tissues in mice from different groups of mice.
Abbreviations: NP, nanoparticle; UA, ursolic acid; UA-NPs, UA-loaded poly(N-vinylpyrrolidone)-block-poly (ε-caprolactone) nanoparticles; H&E, hematoxylin and eosin.