Figures & data
Figure 1 Schematic synthesis of TMAB-functionalized conjugates.
Abbreviations: TMAB, trastuzumab; PTX-NHS, paclitaxel-N-hydroxysuccinimide; NHS, N-hydroxysuccinimide; PEG, polyethylene glycol; MAL, maleimide; FITC, fluorescein isothiocyanate; Cy7, cyanine7; PTX, paclitaxel; PBS, phosphate-buffered saline; DMSO, dimethyl sulfoxide; DMF, dimethylformamide; h, hours; RT, room temperature.
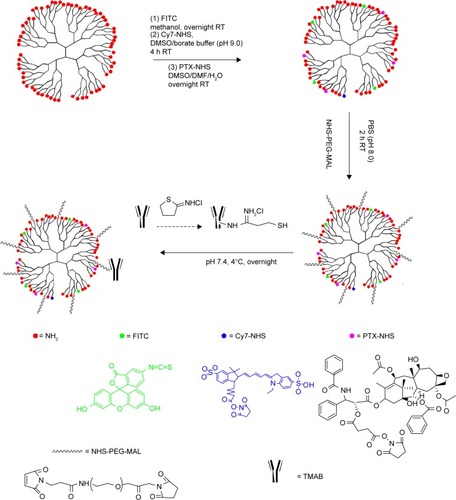
Figure 2 Proton nuclear magnetic resonance (1H-NMR) spectra of PEG-PAMAM-PTX in D2O at 400 MHz.
Note: a–w represent the protons of PEG-PAMAM-PTX.
Abbreviations: PEG, polyethylene glycol; PAMAM, polyamidoamine; PTX, paclitaxel.
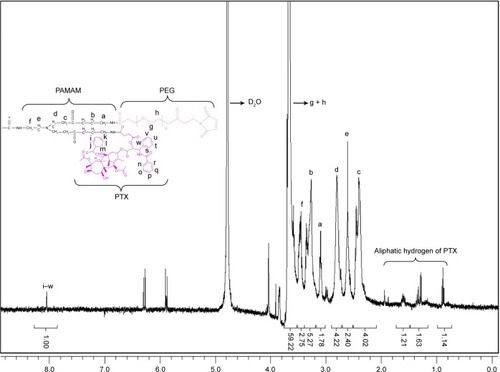
Figure 3 Proton nuclear magnetic resonance (1H-NMR) spectra of (A) PEG-PAMAM-FITC and (B) PEG-PAMAM-Cy7 in D2O at 400 MHz.
Abbreviations: PEG, polyethylene glycol; PAMAM, polyamidoamine; FITC, fluorescein isothiocyanate; Cy7, cyanine7.
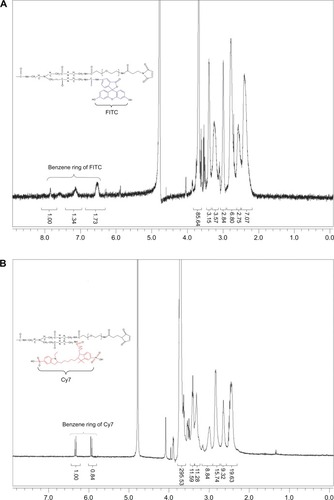
Figure 4 (A) The effect of different thiolation times on the number of sulfhydryls. (B) The effect of different molar ratios of Traut’s reagent to TMAB on the number of sulfhydryls.
Note: The data represent the mean ± SD of three independent experiments.
Abbreviations: TMAB, trastuzumab; SD, standard deviation; h, hours.
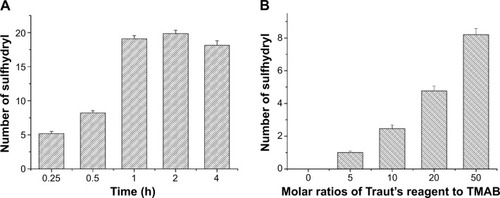
Figure 5 UV-Vis spectroscopy of PAMAM-FITC, TMAB-PEG-PAMAM-FITC, PAMAM-Cy7, TMAB-PEG-PAMAM-Cy7 in H2O.
Note: The increased 280/500 (750) nm ratio (A) for the TMAB-PEG-PAMAM-FITC (Cy7) (B) vs PAMAM-FITC (Cy7) due to the conjugation of TMAB in the former.
Abbreviations: UV-Vis, ultraviolet-visible; TMAB, trastuzumab; FITC, fluorescein isothiocyanate; PAMAM, polyamidoamine; vs, versus; PEG, polyethylene glycol; Cy7, cyanine7.
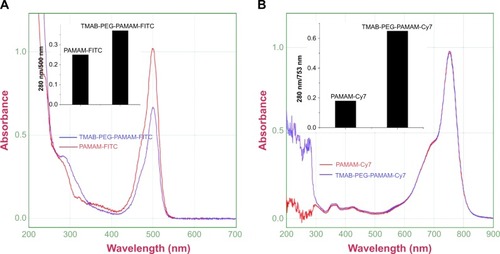
Figure 6 Non-reducing SDS-PAGE of different conjugates. Lanes A–D are TMAB-PEG-PAMAM-PTX, TMAB-PEG-PAMAM-FITC, TMAB-PEG-PAMAM-Cy7, and TMAB, respectively.
Abbreviations: SDS-PAGE, sodium dodecyl sulfate polyacrylamide gel electrophoresis; TMAB, trastuzumab; PEG, polyethylene glycol; PAMAM, polyamidoamine; PTX, paclitaxel; FITC, fluorescein isothiocyanate; Cy7, cyanine7.
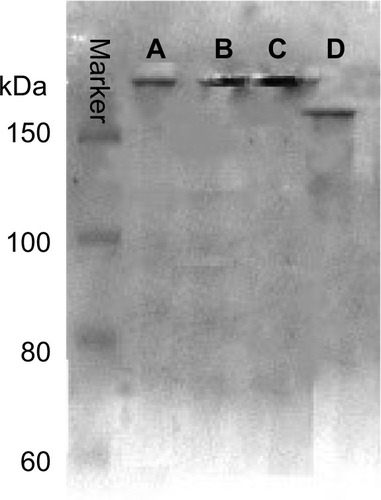
Table 1 Size and zeta potential of different conjugates
Figure 7 Transmission electron microscopy images of (A) TMAB-PEG-PAMAM-PTX, (B) TMAB-PEG-PAMAM-FITC, and (C) TMAB-PEG-PAMAM-Cy7.
Abbreviations: TMAB, trastuzumab; PEG, polyethylene glycol; PAMAM, polyamidoamine; PTX, paclitaxel; FITC, fluorescein isothiocyanate; Cy7, cyanine7.
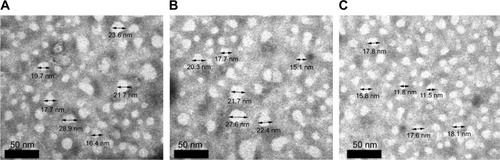
Figure 8 Concentration-dependent binding of TMAB-PEG-PAMAM-FITC and PEG-PAMAM-FITC to BT474 cells (overexpression of HER2) and MCF-7 cells (low expression of HER2). (A) Fluorescence microscopy images of TMAB-PEG-PAMAM-FITC; (B) fluorescence microscopy images of PEG-PAMAM-FITC; and (C) mean fluorescence as measured by flow cytometry.
Notes: The values are the mean ± SD of three independent experiments. The scale bar for A and B is 50 μm.
Abbreviations: TMAB, trastuzumab; PEG, polyethylene glycol; PAMAM, polyamidoamine; FITC, fluorescein isothiocyanate; HER2, human epidermal growth factor receptor 2; SD, standard deviation; TPPF, TMAB-PEG-PAMAM-FITC; PPF, PEG-PAMAM-FITC.
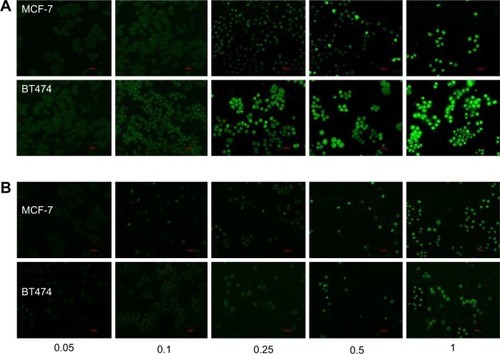
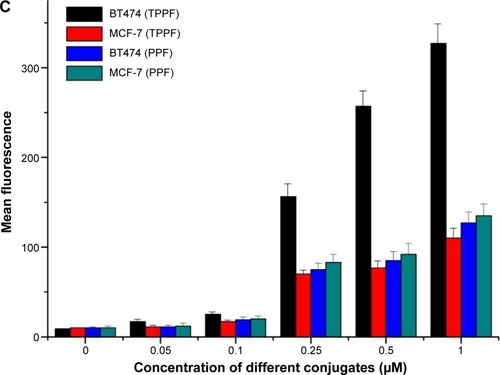
Figure 9 Confocal fluorescence microscopy images and flow cytometry analysis of TMAB-PEG-PAMAM-FITC (A, B, E, F) and PEG-PAMAM-FITC (C, D, G, H) binding to BT474 cells pretreated with TMAB (0.2-fold molar excess) for 30 min. The red arrows indicate fluorescence of TMAB-PEG-PAMAM-FITC and PEG-PAMAM-FITC.
Abbreviations: TMAB, trastuzumab; PEG, polyethylene glycol; PAMAM, polyamidoamine; FITC, fluorescein isothiocyanate; min, minutes.
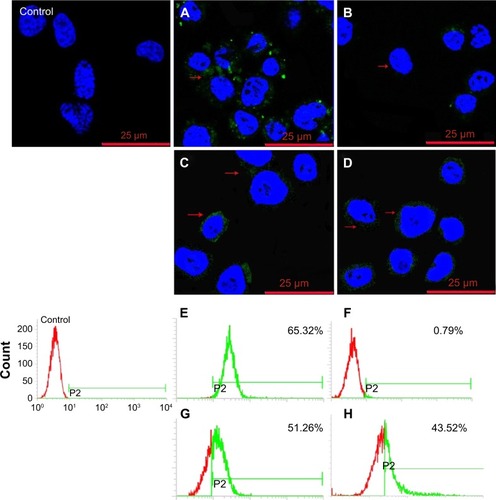
Figure 10 Confocal fluorescence microscopy images of TMAB-PEG-PAMAM-FITC (A–D) and PEG-PAMAM-FITC (E–H) bound to BT474 cells.
Notes: (A, E) FITC-labeled conjugates; (B, F) Lyso-Tracker red-labeled endo-lysosomes; (C, G) Hoechst-labeled nuclei; and (D, H) overlay of A, B, C and E, F, G. The white arrows indicate the conjugates colocalized with lysosome.
Abbreviations: TMAB, trastuzumab; PEG, polyethylene glycol; PAMAM, polyamidoamine; FITC, fluorescein isothiocyanate.
Figure 11 In vitro cytotoxicity of free PTX, PAMAM-PTX, PEG-PAMAM-PTX, and TMAB-PEG-PAMAM-PTX conjugates toward HER2-positive BT474 breast cancer cells.
Notes: The data are presented as the means ± SD. *P<0.05 compared to free paclitaxel.
Abbreviations: PTX, paclitaxel; PAMAM, polyamidoamine; PEG, polyethylene glycol; TMAB, trastuzumab; HER2, human epidermal growth factor 2; SD, standard deviation; IC50, half-maximal inhibitory concentration.
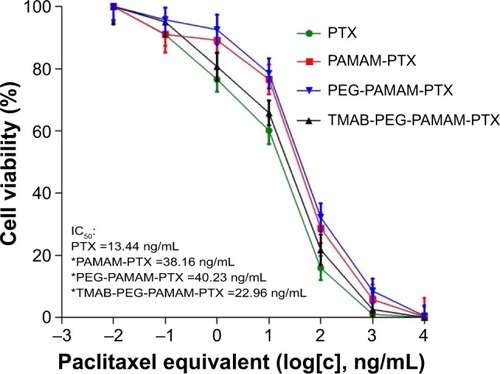
Figure 12 In vivo and ex vivo imaging of BT474 tumor-bearing mice.
Notes: (A) In vivo imaging of BT474 tumor-bearing mice at 0.5, 1, 2, 4, 8, 12, and 24 hours after intravenous injection of PEG-PAMAM-Cy7 (control group) and TMAB-PEG-PAMAM-Cy7 (test group). (B) Ex vivo imaging of tumors and organs excised from BT474 tumor-bearing mice at 24 hours. (C) Analysis of the fluorescence signal (mean fluorescence intensity of the ROIs) in tumors and organs from ex vivo imaging at 24 hours. Experiments were carried out using BT474 tumor-bearing nude mice (n=3) when the tumor volume reached 250 mm3. The data are presented as the means ± SD (n=3). *P<0.05 compared to PEG-PAMAM-Cy7.
Abbreviations: PEG, polyethylene glycol; PAMAM, polyamidoamine; Cy7, cyanine7; TMAB, trastuzumab; SD, standard deviation; ROI, region of interest; h, hours.
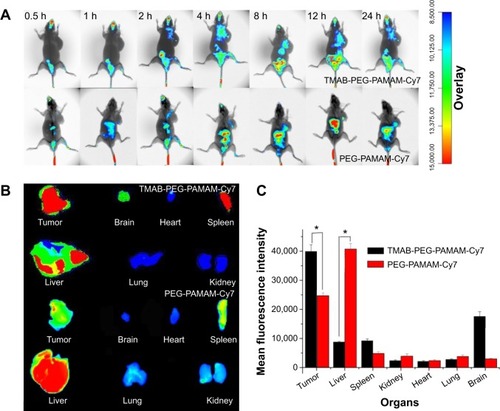
Figure S1 Electrospray ionization mass spectra (ESI-MS) of PTX-2′-hemisuccinate.
Abbreviations: min, minutes; frag, fragments; PTX, paclitaxel; vs, versus.
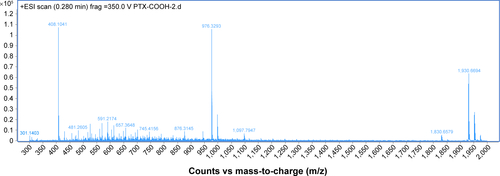
Figure S2 1H-NMR of SDPP in CCI3D at 400 MHz.
Abbreviations: 1H-NMR, proton nuclear magnetic resonance; SDPP, N-hydroxysuccinimide diethyl phosphate.
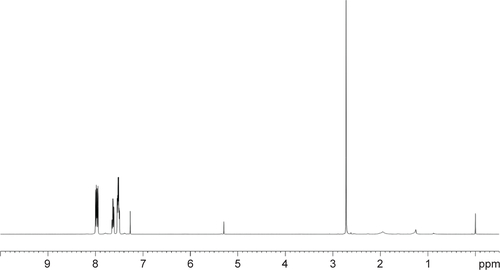
Figure S3 Electrospray ionization mass spectra (ESI-MS) of PTX-NHS.
Abbreviations: PTX, paclitaxel; NHS, N-hydroxysuccinimide; min, minutes; frag, fragments; vs, versus.
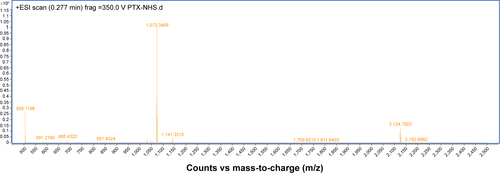
Figure S4 Schematic synthesis of PTX-NHS.
Abbreviations: h, hours; min, minutes; PTX, paclitaxel; NHS, N-hydroxysuccinimide; DMAP, 4-dimethylaminopyridine; RT, room temperature; DCM, dichloromethane.
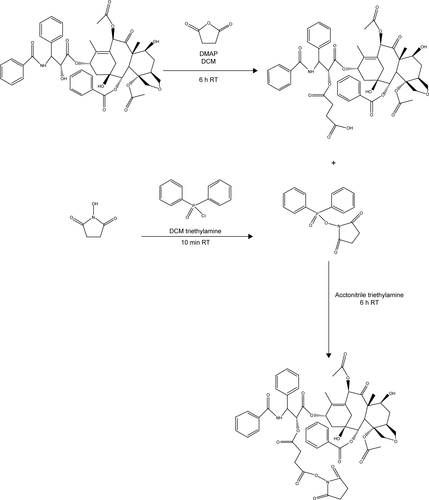
Figure S5 Proton nuclear magnetic resonance (1H-NMR) spectra of PAMAM-PTX in D2O at 400 MHz.
Note: a–f represent the protons of PAMAM.
Abbreviations: PAMAM, polyamidoamine; PTX, paclitaxel.
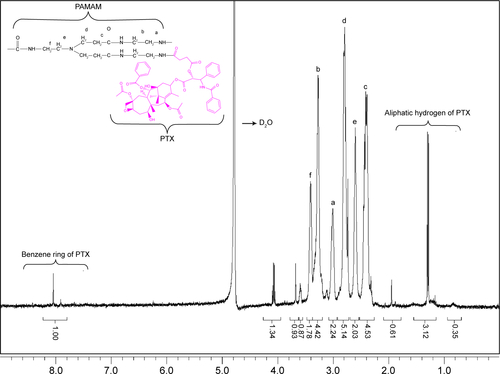
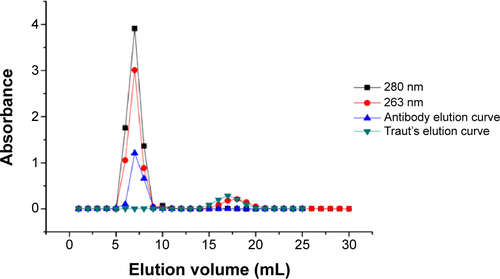
Figure S6 The elution curve of thiolated TMAB and Traut’s reagent.
Abbreviation: TMAB, trastuzumab.