Figures & data
Table 1 Primers used for quantitative polymerase chain reaction
Table 2 Basic features of the blended nanofibrous membrane
Figure 1 Transmission of light in nanofibrous membranes with different blend ratios.
Notes: General transmission of light is shown in (A). Scanning electron microscopy results are shown in (B–F). (B) 100% SF, (C) 75% SF, (D) 50% SF, (E) 25% SF, and (F) 0% SF. Scale bar, 5 μm. Accurate transmission percentage compared with the control group is shown in (G).
Abbreviation: P(LLA-CL), poly(l-lactic acid-co-ε-caprolactone); SF, silk fibroin.
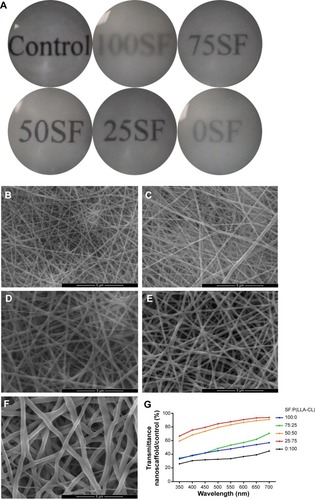
Figure 2 Cells adhering to different blend ratio nanoscaffolds.
Notes: Violet crystals reflect the HCEC-B4G12 numbers and are recorded in (A). After dissolving the violet crystals in dimethyl sulfoxide, absorbance at 490 nm was measured, and the results are shown in (B). **P<0.01.
Abbreviations: SF, silk fibroin; P(LLA-CL), poly(l-lactic acid-co-ε-caprolactone); OD, optical density; HCEC, human corneal endothelial cells.
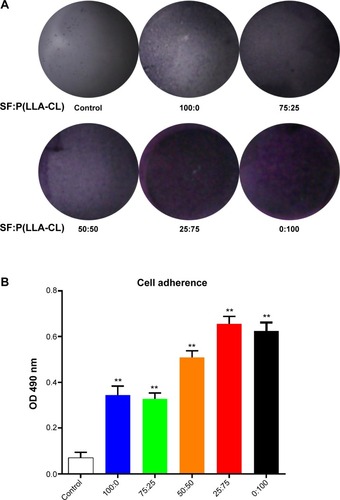
Figure 3 Cell viability and proliferation on different SF/P(LLA-CL) membranes.
Notes: The first row of (A) shows the results of the live/dead kit test, and few dead cells can be seen. The second row of (A) shows Ki-67 protein staining, and the third row of (A) shows BrdU staining under laser scanning confocal microscopy. The scale bar indicates 50 μm in (A). The histogram of the positive percentage of Ki-67 protein staining is shown in (B). The histogram of the positive percentage of BrdU staining is shown in (C). *P<0.05, **P<0.01.
Abbreviations: DAPI, 4,6-diamidino-2-phenylindole; SF, silk fibroin; P(LLA-CL), poly(l-lactic acid-co-ε-caprolactone).
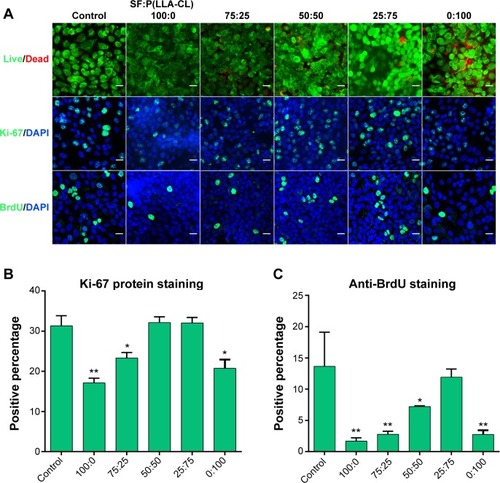
Figure 4 Monolayer formation on different SF/P(LLA-CL) membranes. HCEC-B4G12 cells were cultured on different membranes for 1 week for monolayer formation.
Notes: Scanning electron microscopic images showed that the B4G12 cells could form a monolayer on all membranes and on glass coverslips (control group), as shown in (A). ZO-1 staining of monolayers is shown in (B). Scale bar, 20 μm.
Abbreviations: DAPI, 4,6-diamidino-2-phenylindole; SF, silk fibroin; P(LLA-CL), poly(l-lactic acid-co-ε-caprolactone); HCEC, human corneal endothelial cells; ZO-1, zona occludens-1.
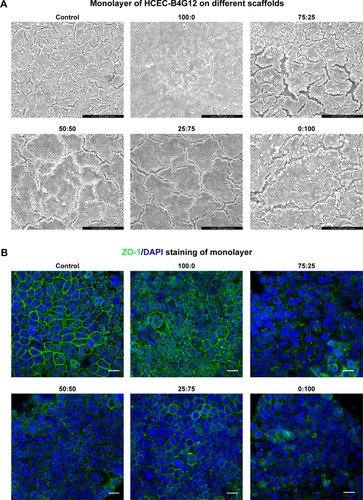
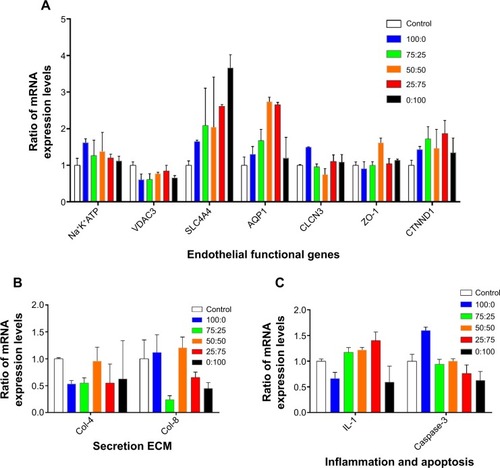
Figure 5 Gene expression on different membranes.
Notes: (A) Expression of seven functional correlation genes was tested. (B) Two extracellular matrices, collagen IV and collagen VIII, were detected. (C) Interleukin-1 (an inflammatory cytokine) and caspase-3 (an apoptosis-related gene) were tested.
Abbreviations: AQP1, aquaporin 1; CLCN3, voltage-sensitive 3 chloride channel; ZO-1, zona occludens-1; Col-4, collagen type IV; Col-8, collagen type VIII; CTNND1, cadherin-associated protein; IL-1, interleukin-1; Na+K+ATPase, Na+/K+ transporting, alpha 1 polypeptide; SLC4A4, sodium bicarbonate cotransporter member 4; VDAC3, voltage-dependent anion channel 3; ECM, extracellular matrix.