Figures & data
Figure 1 Effect of in vitro incubation of gH625 with SH-SY5Y cells and U-87 MG cells on cell viability and maximal oxidative capacity.
Notes: MTT assay for SH-SY5Y cells (A) and astrocytoma U87-MG cells (B). Indicated as zero peptide in the figure is the negative control corresponding to the cells treated with vehicle (the same amount in μL of the 15 μM peptide concentration). Oxidative capacity is detected as cytochrome oxidase activity in SH-SY5Y cells (C) and in U-87 MG cells (D). Values represent the mean ± standard error of five separate incubations.
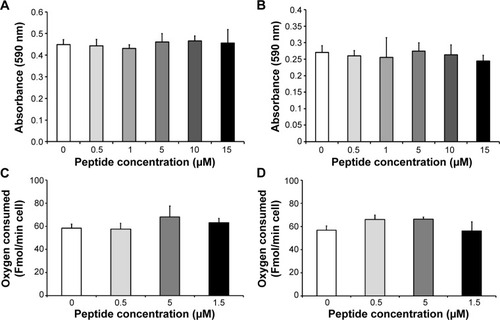
Figure 2 In vitro uptake of 5 μM gH625.
Notes: The left column shows images acquired with differential interference contrast, the central column with the fluorescein isothiocyanate channel, and the right column with the 4′-6-diamidino-2-phenylindole channel. Each row represents the same field. (A–C) Negative controls for SH-SY5Y cells. (D–F) SH-SY5Y cells treated with gH625. (G–I) Negative controls for U-87 MG cells. (J–L) U-87 MG cells treated with gH625. Scale bars correspond to 50 μm, except for (D–F) where they correspond to 20 μm.
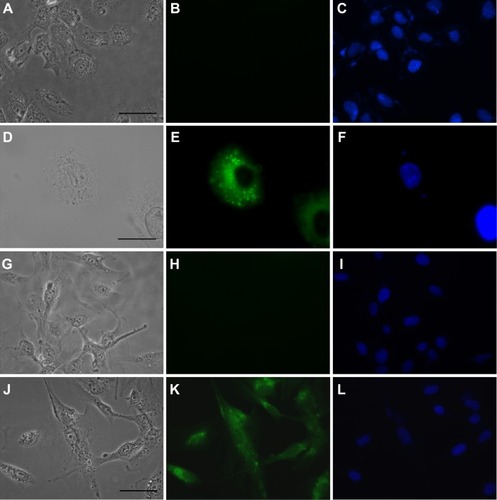
Figure 3 (A) Spectrofluorimetric analysis of SH-SY5Y cell uptake after exposure to gH625, 1 and 5 μM. (B) Spectrofluorimetric analysis of U-87 MG cell uptake after exposure to gH625, 1 and 5 μM.
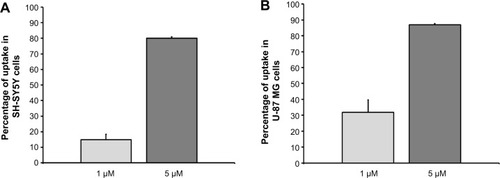
Figure 4 Reversed-phase high-performance liquid chromatography analysis of serum stability.
Notes: Representative chromatograms after several incubation times: 0 minutes (A); 90 minutes (B); 30 minutes (C); 210 minutes (D).
Abbreviation: mAU, milli absorbance units.
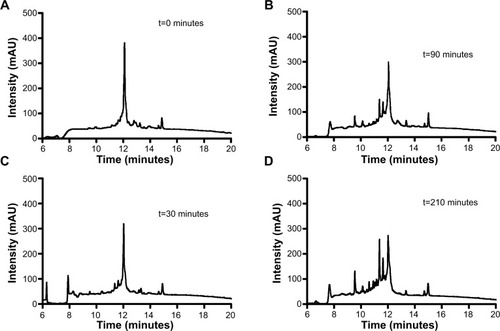
Figure 5 Stability of the gH625 peptide in serum.
Notes: The remaining peptide is reported as a function of time. Values represent the mean ± standard error of three different experiments.
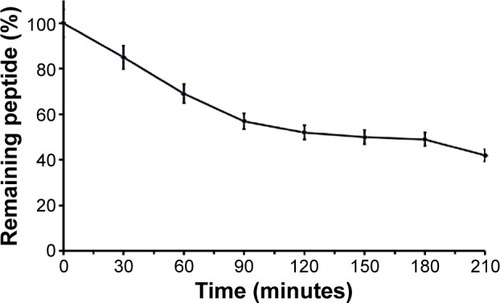
Figure 6 Representative histological images of the liver and brain in control rats and rats treated with 16 μM gH625.
Notes: The left column shows bright-field images and the right column shows the fluorescein isothiocyanate channel. Each row represents the same field. The scale bar corresponds to 50 μm. (A, B) Liver section of negative control, (C, D) liver of treated animal showing Kupffer cell (arrows) overfilled with gH625, (E, F) a brain section from a negative control, and (G, H) brain of treated animals showing the presence of gH625 in nerve cell processes (arrows).
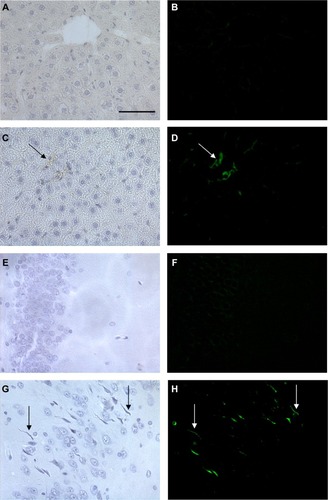
Figure 7 Green fluorescence evaluation of control and gH625-treated brain slices. The ratio of mean fluorescence outside and inside the blood vessels of the blood–brain barrier was calculated for at least ten slices (control animals n=3, treated animals n=3). **P<0.01.
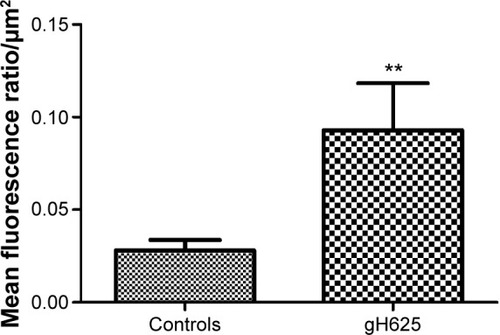
Figure 8 Representative images of brain immunofluorescence using anti-BBB and anti-GFAP in control and gH625-treated animals.
Notes: From left to right, the columns show AlexaFluor594, fluorescein isothiocyanate, DAPI, and merged and colocalization map images, respectively. For the colocalization map (from -1 to 1) a color scale is provided: negative indices (cold colors) represent no colocalization, while indices above 0 (hot colors) represent colocalization. (A–a4) Negative control (omission of primary antibody) for anti-BBB immunofluorescence in control animal (vehicle or gH625 without NBD) showing low red background and no green signal (anti-GFAP negative control showed the same pattern and is not shown). Scale bar corresponds to 50 μm. (B–b4) Anti-GFAP immunofluorescence in a control animal. Scattered spots of low green signal were due to red blood cells. Scale bar 50 μm. (C–c4) Anti-GFAP immunofluorescence in a gH625-treated animal showing no overlapping of red and green signal. Scale bar corresponds to 20 μm. (D–d4) Anti-BBB immunofluorescence in a control animal. Scattered spots of low green signal can be attributed to red blood cells. Scale bar corresponds to 50 μm. (E–e4) Anti-BBB immunofluorescence in a gH625-treated animal showing overlapping of red and green signal. Scale bar corresponds to 20 μm. (F–f4) Anti-BBB immunofluorescence in a gH625-treated animal showing that the presence of gH625 beyond the BBB can be associated to nerve cell processes. Scale bar corresponds to 20 μm.
Abbreviations: BBB, blood–brain barrier; GFAP, glial fibrillary acidic protein; NBD, 7-nitrobenz-2-oxa-1,3-diazole-4-yl; DAPI, 4,6-diamidino-2-phenylindole; nMDP, normalized mean deviation product.
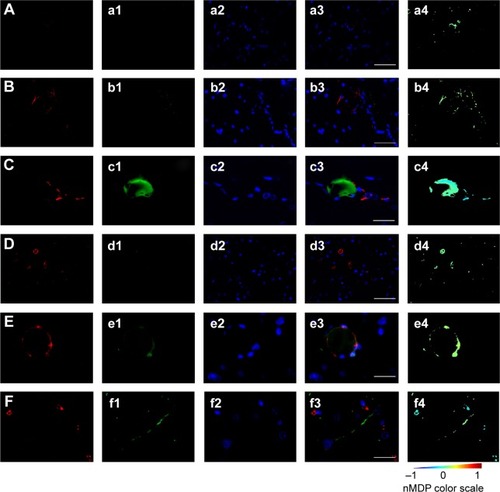
Figure 9 Immunofluorescence for anti-tubulin III on cerebral cortex sections from gH625-NBD-treated animals.
Notes: (A) Neurons appear largely without labeling for gH625-NBD, while the peptide signal is restricted to narrow areas (arrows). (B) In some neurons, gH625-NBD colocalizes with anti-tubulin III near the perikaryon. Other cytotypes are also labeled for gH625-NBD (arrow head). (C) DAPI staining of neuron nuclei. (D) Neurons immunoreactive for anti-tubulin III (magenta: false color) in the perikaryon and axons. (E) The same field in the fluorescein isothiocyanate channel shows the same neuron in (D) which is strongly labeled for gH625-NBD. (F) nMDP distribution colocalization color map of overlapping (D) and (E); the image clearly shows that gH625-NBD colocalizes with anti-tubulin III in the perikaryon and the axon emergence, exclusively. (G) Merged image of the aforementioned three channels, ie, DAPI, AlexaFluor594, and fluorescein isothiocyanate. Scale bar: 50 μm for (A, B) and 10 μm for (C–G).
Abbreviations: NBD, 7-nitrobenz-2-oxa-1,3-diazole-4-yl; DAPI, 4,6-diamidino-2-phenylindole; nMDP, normalized mean deviation product.

Figure 10 Pixel count and pixel correlation analysis on images from control and gH625 NBD treated experimental groups.
Notes: Distribution of nMDP shows the degree of colocalization in the control, ie, vehicle or gH625 without NBD (solid lines) and gH625/anti-BBB (dashed lines) (A). The index of correlation histogram comparing control and gH625/anti-BBB images shows a high fraction of positively correlated pixels (B). Distribution of nMDP shows the degree of colocalization between the control (solid lines) and gH625/anti-GFAP (dashed lines) (C). The index of correlation comparison between control and gH625/anti-GFAP showing a low fraction of positively correlated pixels in the images (D).
Abbreviations: BBB, blood–brain barrier; GFAP, glial fibrillary acidic protein; NBD, 7-nitrobenz-2-oxa-1,3-diazole-4-yl; nMDP, normalized mean deviation product.
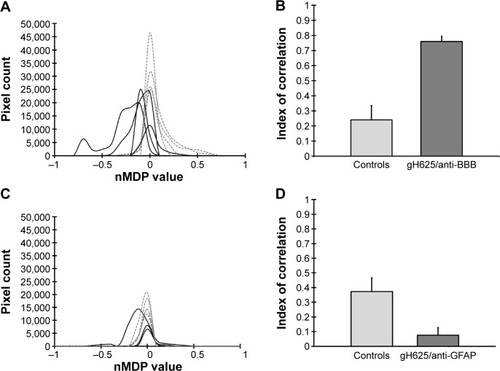
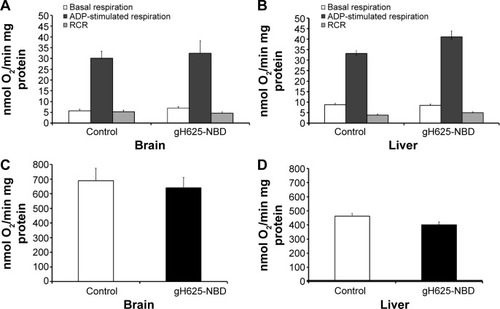
Figure 11 Effect of in vivo administration of gH625 on mitochondrial respiration and cytochrome oxidase activity detected in brain (A, C) and liver (B, D) homogenates in the rat. Values represent the mean ± standard error of three homogenate preparations from different rats.
Notes: Each experiment was performed in triplicate. Control rats received vehicle.
Abbreviations: ADP, adenosine diphosphate; NBD, 7-nitrobenz-2-oxa-1,3-diazole-4-yl; RCR, respiratory control ratio.