Figures & data
Figure 1 Cell labeling.
Notes: (A) Non-labeled bone marrow-derived mesenchymal stem cells in vitro (×100). (B) Prussian blue-stained, labeled cells (×100). The majority of blue-stained iron particles were distributed in the cytoplasm, whereas a small amount of particles adhered to the cell membrane (red arrows in inset). (C) Electron microscopic images of labeled MSCs shows dense particles (red arrows) clustered within the cytoplasm.
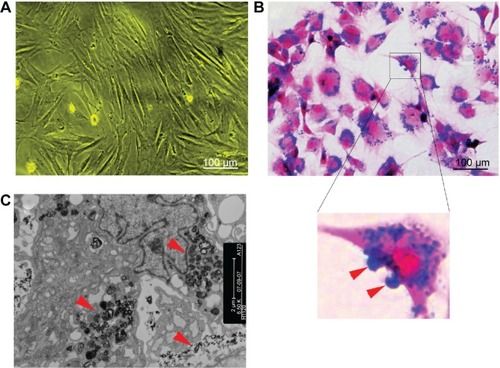
Figure 2 Release rate of intracellular iron in vitro.
Notes: (A) Prussian blue staining of SPIO-MSCs at different times after SPIO labeling (all figures in A are at 50 μm in size range). (B) Quantitative analysis showing that the intracellular mean iron load decreased continuously over time after magnetic labeling. (C) Electron microscopic images of MSCs at 4 days after labeling showed the release of iron dense particles (red arrow) from the cytoplasm.
Abbreviations: d, days; SPIO, superparamagnetic iron oxide; MSCs, mesenchymal stem cells; SPIO-MSCs, mesenchymal stem cells incubated with superparamagnetic iron oxide.
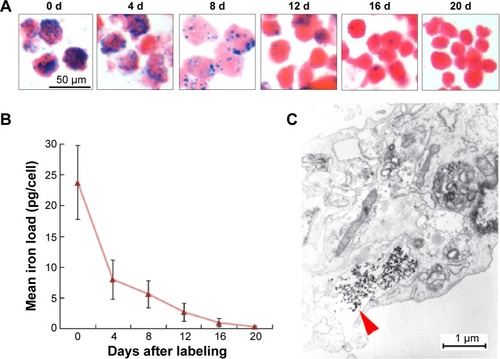
Figure 3 Proliferation, viability, and differentiation capacity of SPIO-MSCs.
Notes: (A) Proliferation rate of SPIO-MSCs. (B) Viability rate of SPIO-MSCs. (C) Oil red O staining for adipogenic differentiation (both images in C are at 100 μm in size range). (D) RT-PCR for myocardial gene cTnT, Desmin, and α-cardiac actin. (E) Quantitative gene expression analysis. SPIO labeling did not affect the proliferation, viability, and differentiation capacity of MSCs.
Abbreviations: MSCs, mesenchymal stem cells; SPIO, superparamagnetic iron oxide; SPIO-MSCs, mesenchymal stem cells incubated with superparamagnetic iron oxide; RT-PCR, real-time quantitative polymerase chain reaction; GAPDH, glyceraldehyde 3-phosphate dehydrogenase; NS, not significant; NC, negative control; PC, positive control.
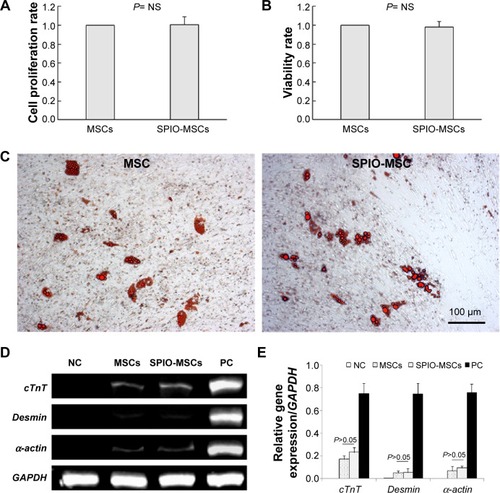
Figure 4 In vivo magnetic resonance imaging.
Notes: (A) In vivo magnetic resonance imaging of tube-containing gel with 5×10⁵ unlabeled MSCs, living SPIO-MSCs, dead SPIO-MSCs, and SPIO alone (0.6 μL Resovist) without MSCs, respectively. (B) Quantitative analysis of signal intensity. Equation for SI is ⊿SI = [(SI−SIunlabeled MSCs)/SIunlabeled MSCs] ×100%.
Abbreviations: MSCs, mesenchymal stem cells; SPIO, superparamagnetic iron oxide; SPIO-MSCs, mesenchymal stem cells incubated with superparamagnetic iron oxide; SI, signal intensity; FSE, fast spin echo; T1WI, T1 weighted imaging; T2WI, T2 weighted imaging; T2*WI, T2 star weighted imaging.
![Figure 4 In vivo magnetic resonance imaging.Notes: (A) In vivo magnetic resonance imaging of tube-containing gel with 5×10⁵ unlabeled MSCs, living SPIO-MSCs, dead SPIO-MSCs, and SPIO alone (0.6 μL Resovist) without MSCs, respectively. (B) Quantitative analysis of signal intensity. Equation for SI is ⊿SI = [(SI−SIunlabeled MSCs)/SIunlabeled MSCs] ×100%.Abbreviations: MSCs, mesenchymal stem cells; SPIO, superparamagnetic iron oxide; SPIO-MSCs, mesenchymal stem cells incubated with superparamagnetic iron oxide; SI, signal intensity; FSE, fast spin echo; T1WI, T1 weighted imaging; T2WI, T2 weighted imaging; T2*WI, T2 star weighted imaging.](/cms/asset/beaa5fc8-e107-4984-82bf-38940b19fcb2/dijn_a_77858_f0004_c.jpg)
Figure 5 CMR imaging.
Notes: (A) Representative in vivo CMR imaging of injected 5×10⁵ unlabeled MSCs, (B) living SPIO-MSCs, (C) dead SPIO-MSCs, and (D) SPIO (0.6 μL Resovist) in swine heart. Red arrows in figures B–D indicate the signal void corresponding to the injection sites. (E) Quantitative analysis of signal intensity. ⊿SI=[(SI−SIunlabeled MSCs)/SIunlabeled MSCs]×100%.
Abbreviations: CMR, cardiac magnetic resonance; LV, left ventricle; MSCs, mesenchymal stem cells; NS, not significant; RV, right ventricle; SPIO, superparamagnetic iron oxide; SPIO-MSCs, mesenchymal stem cells incubated with superparamagnetic iron oxide; SI, signal intensity.
![Figure 5 CMR imaging.Notes: (A) Representative in vivo CMR imaging of injected 5×10⁵ unlabeled MSCs, (B) living SPIO-MSCs, (C) dead SPIO-MSCs, and (D) SPIO (0.6 μL Resovist) in swine heart. Red arrows in figures B–D indicate the signal void corresponding to the injection sites. (E) Quantitative analysis of signal intensity. ⊿SI=[(SI−SIunlabeled MSCs)/SIunlabeled MSCs]×100%.Abbreviations: CMR, cardiac magnetic resonance; LV, left ventricle; MSCs, mesenchymal stem cells; NS, not significant; RV, right ventricle; SPIO, superparamagnetic iron oxide; SPIO-MSCs, mesenchymal stem cells incubated with superparamagnetic iron oxide; SI, signal intensity.](/cms/asset/c76f9276-f165-4c8d-be7c-c8b6b8bd35c5/dijn_a_77858_f0005_c.jpg)
Figure 6 Long-term CMR tracking.
Notes: (A) Representative serial long-axis views imaged at 3 d, 1 m, 3 m, and 6 m after infarction show the signal void (red arrows) gradually faded over time. (B) The number of visible injection sites by CMR gradually decreased over time post-injection.
Abbreviations: CMR, cardiac magnetic resonance; d, days; m, months.
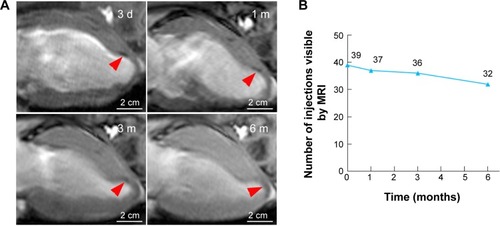
Figure 7 Representative histology of the injection sites 6 months after cell injection.
Notes: (A) HE staining. A1 is the inset of A and shows the giant multinucleated cells. (B) Prussian blue staining. B1 inset shows the giant multinucleated cells at the corresponding site to A1 inset. (B2) inset shows the iron-containing, small-sized, non-macrophage interstitial cells. (C) CD68 immunohistochemical staining. C1 inset showing the CD68-positive giant multinucleated cells at the corresponding site to A1 inset and B1 inset. Massive Prussian blue-positive iron deposits were detected at the injection sites. Iron particles were predominantly distributed in the extracellular space (red arrows in A–C), whereas a minority of iron particles were distributed within CD68-positive macrophages (white arrows in A1, BI and C1) and other CD68-negative cells (black arrows in B2).
Abbreviation: HE, hematoxylin eosin.
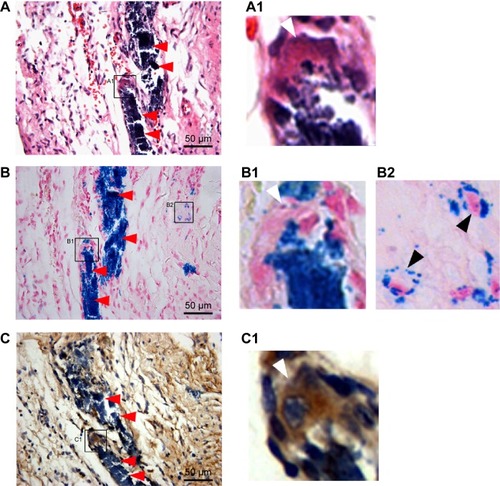
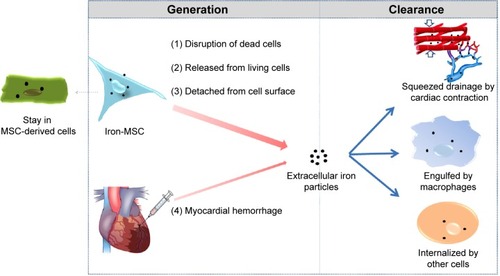
Figure 8 The source and clearance of the extracellular SPIO particles in the myocardium.
Abbreviations: MSC, mesenchymal stem cell; SPIO, superparamagnetic iron oxide.