Figures & data
Figure 1 Structures of pH-dependent lactone and carboxylate forms of SN38.
Abbreviation: SN38, 7-Ethyl-10-hydroxycamptothecin.
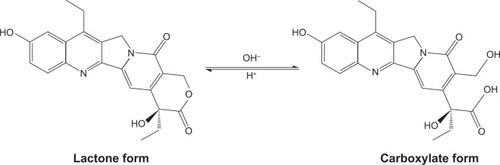
Figure 2 Synthesis of succinyl-SN38 derivatives, CS-(10s)SN38 and CS-(20s)SN38.
Abbreviations: CS-(10s)SN38, chitosan-(C10-OH)SN38; CS-(20s)SN38, chitosan-(C20-OH)SN38; DCM, dichloromethane; DIPEA, N,N-diisopropylethylamine; DMAP, 4-dimethylamiopyridine; DMSO, dimethyl sulfoxide; EDC, 1-ethyl-3-(3-dimethy laminopropyl) carbodiimide hydrochloride; NHS, N-hydroxysuccinimide; SA, succinic acid; TFA, trifluoroacetic acid; SN38, 7-Ethyl-10-hydroxycamptothecin.
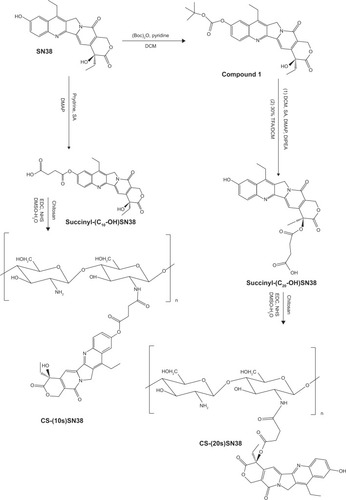
Figure 3 1H NMR spectra of (A) chitosan, (B) CS-(10s)SN38, and (C) CS-(20s)SN38.
Abbreviations: CS-(10s)SN38, chitosan-(C10-OH)SN38; CS-(20s)SN38, chitosan-(C20-OH)SN38; NMR, nuclear magnetic resonance; SN38, 7-Ethyl-10-hydroxycamptothecin.
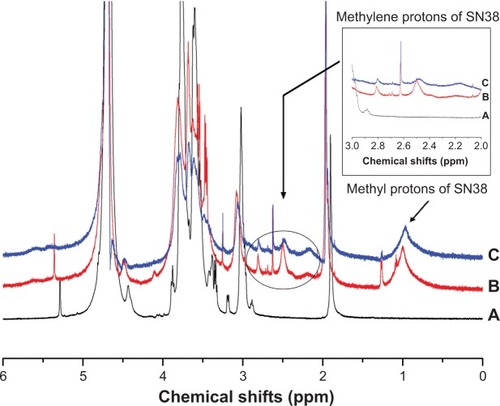
Figure 4 FT-IR spectra of (A) chitosan, (B) CS-(10s)SN38, (C) CS-(20s)SN38, (D) SN38, and (E) mixture of SN38 and chitosan.
Abbreviations: CS-(10s)SN38, chitosan-(C10-OH)SN38; CS-(20s)SN38, chitosan-(C20-OH)SN38; FT-IR, Fourier transform infrared; SN38, 7-Ethyl-10-hydroxycamptothecin.
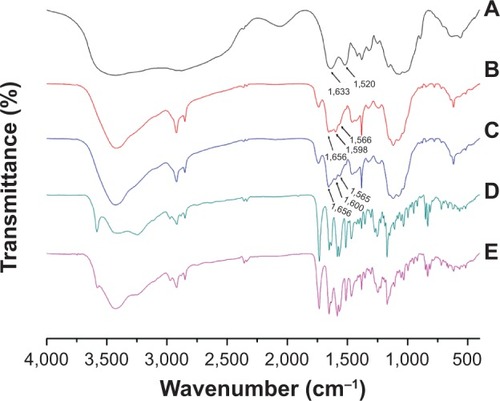
Figure 5 DSC spectra of (A) SN38, (B) physical mixture of SN38 and chitosan (17:83, w/w), (C) chitosan, (D) CS-(10s)SN38, and (E) CS-(20s)SN38 (drug loading is about 17%).
Abbreviations: CS-(10s)SN38, chitosan-(C10-OH)SN38; CS-(20s)SN38, chitosan-(C20-OH)SN38; DSC, differential scanning calorimetry; SN38, 7-Ethyl-10-hydroxy-camptothecin.
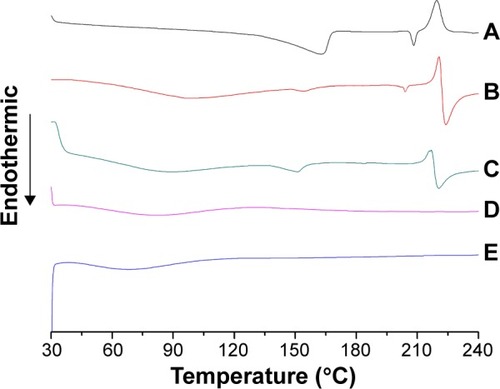
Figure 6 Plot of the fluorescence intensity as a function of the natural logarithm concentration of (A) CS-(10s)SN38 and (B) CS-(20s)SN38.
Abbreviations: a.u., arbitrary unit; CS-(10s)SN38, chitosan-(C10-OH)SN38; CS-(20s)SN38, chitosan-(C20-OH)SN38; Ln C, Napierian logarithm of concentration; SN38, 7-Ethyl-10-hydroxycamptothecin.
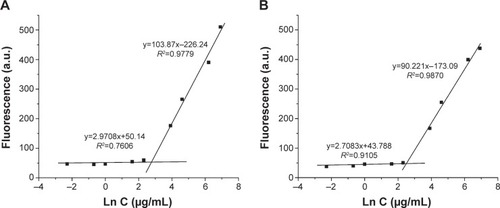
Figure 7 Particle size distributions and TEM images of (A) CS-(10s)SN38 and (B) CS-(20s)SN38.
Note: Scale bar indicates 500 nm.
Abbreviations: CS-(10s)SN38, chitosan-(C10-OH)SN38; CS-(20s)SN38, chitosan-(C20-OH)SN38; TEM, transmission electron microscopy; SN38, 7-Ethyl-10-hydroxycamptothecin.
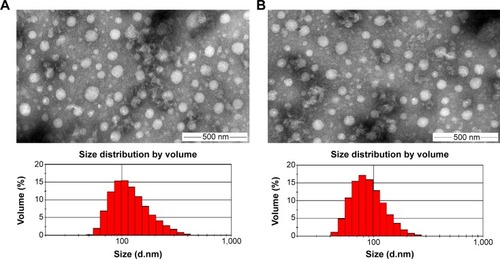
Figure 8 Hydrolytic process of CS-(10s)SN38 and CS-(20s)SN38.
Notes: (A) rupture of amide bond; (B) rupture of ester bond.
Abbreviations: CS-(10s)SN38, chitosan-(C10-OH)SN38; CS-(20s)SN38, chitosan-(C20-OH)SN38; SN38, 7-Ethyl-10-hydroxycamptothecin.
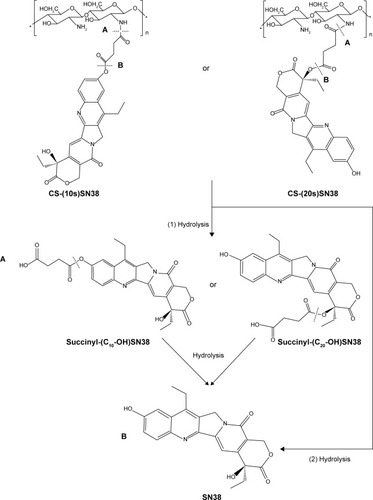
Figure 9 Drug release profiles of CS-(10s)SN38 compared with CS-(20s)SN38 in different media at 37°C: (A) SN38 released from CS-(10s)SN38, (B) SN38 released from CS-(20s)SN38, (C) succinyl-(C10-OH)SN38 released from CS-(10s)SN38, and (D) succinyl-(C20-OH)SN38 released from CS-(20s)SN38.
Notes: Data are shown as mean ± standard deviation; n=3.
Abbreviations: CS-(10s)SN38, chitosan-(C10-OH)SN38; CS-(20s)SN38, chitosan-(C20-OH)SN38; PBS, phosphate-buffered saline; SN38, 7-Ethyl-10-hydroxycamptothecin.
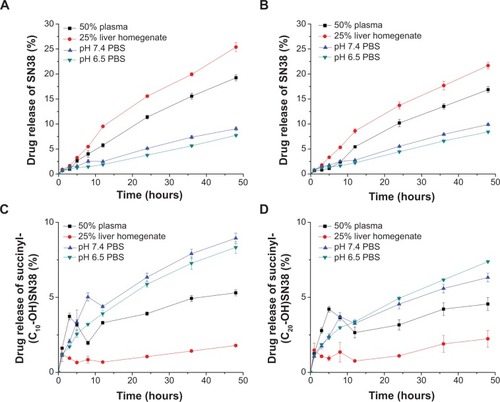
Table 1 Cytotoxicity of different forms of SN38 in murine colon adenocarcinoma cell line CT26
Table 2 Pharmacokinetic parameters of free SN38 after intravenous administration of 10 mg/kg CS-(10s)SN38, CS-(20s)SN38, and CPT-11
Figure 10 Plasma concentrations of SN38 after intravenous administration of 10 mg/kg CS-(10s)SN38, CS-(20s)SN38, and CPT-11.
Notes: All preparations were equivalent to SN38; data are shown as mean ± standard deviation; n=6.
Abbreviations: CS-(10s)SN38, chitosan-(C10-OH)SN38; CS-(20s)SN38, chitosan-(C20-OH)SN38; SN38, 7-Ethyl-10-hydroxycamptothecin.
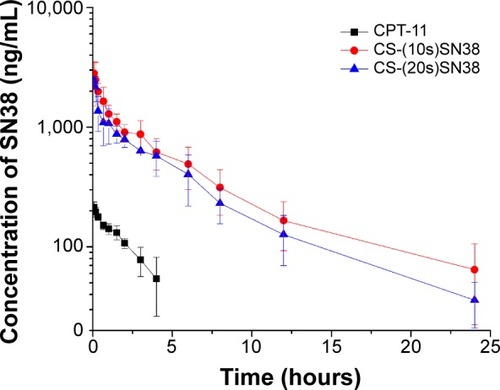
Table 3 Pharmacokinetic parameters of prodrugs after intravenous administration of 10 mg/kg CS-(10s)SN38, CS-(20s)SN38, and CPT-11
Figure 11 Plasma concentrations of SN38 (in prodrug form) after intravenous administration of 10 mg/kg CS-(10s)SN38, CS-(20s)SN38, and CPT-11.
Notes: All preparations and concentrations were equivalent to SN38; data are shown as mean ± standard deviation; n=6.
Abbreviations: CS-(10s)SN38, chitosan-(C10-OH)SN38; CS-(20s)SN38, chitosan-(C20-OH)SN38; SN38, 7-Ethyl-10-hydroxycamptothecin.
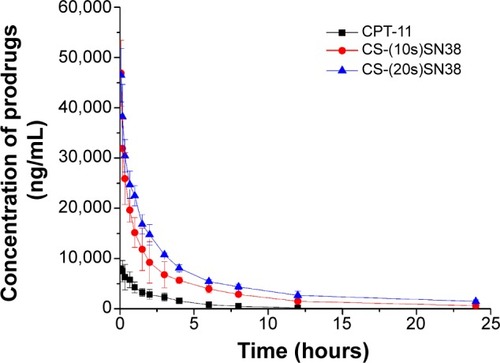
Table 4 Anti-tumor effect of CPT-11, CS-(10s)SN38, and CS-(20s)SN38 in CT26 xenograft BALB/c mouse model
Figure 12 In vivo antitumor results of CT26 xenograft BALB/c mice; (A) the tumor growth curves of CT26 xenograft BALB/c mice after intravenous administration of saline, CPT-11, CS-(10s)SN38, and CS-(20s)SN38, (B) pathological section images of cancer tumor of BALB/c mice treated by CPT-11, CS-(10s)SN38, and CS-(20s)SN38.
Notes: Data are shown as mean ± standard deviation; n=8; magnification 400×. The white arrows in the saline group represent tumor cells and muscle infiltration; the white arrows in the other groups represent tumor tissue necrosis.
Abbreviations: CPT-11, irinotecan; CS-(10s)SN38, chitosan-(C10-OH)SN38; CS-(20s)SN38, chitosan-(C20-OH)SN38; SN38, 7-Ethyl-10-hydroxycamptothecin.
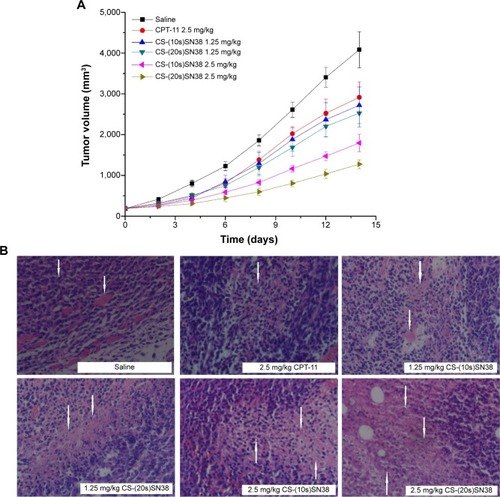
Figure 13 Body weight change of CT26 xenograft BALB/c mice after intravenous administration of saline, CPT-11, CS-(10s)SN38, and CS-(20s)SN38.
Notes: Data are shown as mean ± standard deviation; n=8.
Abbreviations: CPT-11, irinotecan; CS-(10s)SN38, chitosan-(C10-OH)SN38; CS-(20s)SN38, chitosan-(C20-OH)SN38; SN38, 7-Ethyl-10-hydroxycamptothecin.
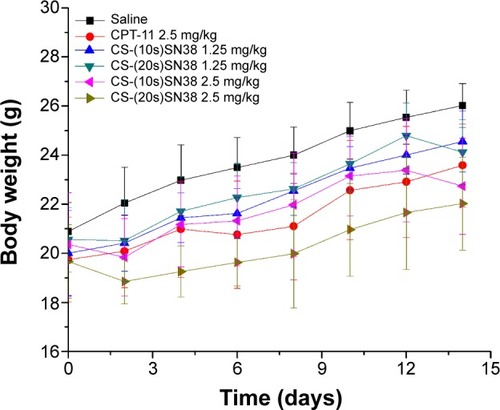
Figure S1 The recovery rate of the lactone form of SN38 at 37°C.
Notes: The recovery rate experiment was carried out to confirm that the treatment of NaOH only caused hydrolysis of SN38 and reversible transformation from the lactone form to the carboxylate form. SN38 was not degraded during the treatment. Data are shown as mean ± standard deviation; n=3.
Abbreviation: SN38, 7-Ethyl-10-hydroxycamptothecin.
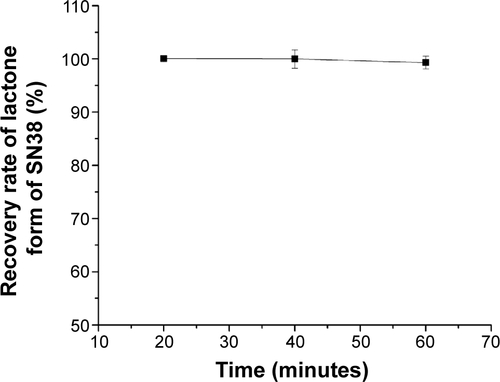
Figure S2 1H NMR spectra of (A) succinyl-(C10-OH)SN38 and (B) succinyl-(C20-OH)SN38.
Notes: For succinyl-(C10-OH)SN38 (A), the absorption peak of C10-OH disappeared (10.33 ppm) due to the esterification of succinic acid with the phenolic hydroxyl group (C10-OH) of SN38. The chemical shift of C20-OH was 5.75 ppm (marked with the blue circle). In the case of succinyl-(C20-OH)SN38, the chemical shift of C10-OH can be seen at 10.33 ppm (marked with the red circle in B). The disappearance of the absorption peak of C20-OH, indicating that the succinyl-linker was conjugated to SN38 at C20-OH.
Abbreviations: NMR, nuclear magnetic resonance; SN38, 7-Ethyl-10-hydroxycamptothecin.
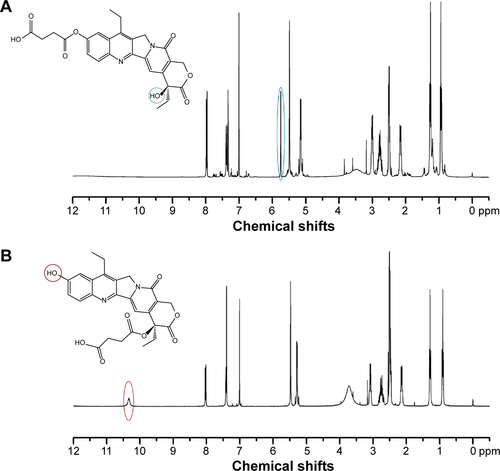
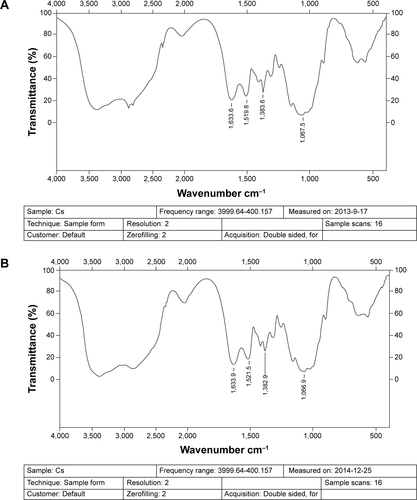
Figure S3 Scanned images of FT-IR spectra of chitosan: (A) old FT-IR spectrum and (B) new FT-IR spectrum.
Abbreviation: FT-IR, Fourier transform infrared.