Figures & data
Table 1 Physicochemical characteristics of CdTe QDs used in the experiments
Figure 1 Light transmission aggregometry measurement of interactions between CdTe QDs and platelets and flow-cytometry measurement of P-selectin expression.
Notes: PRP (A, C) or WP (B, D) were treated with positively charged (2.8 nm) or negatively charged (2.6 nm or 4.8 nm) CdTe QDs in the optical aggregometer. Similarly, P-selectin expression with PRP (E) or WP (F) was measured with and without treatment with CdTe QDs. Positive control (control/collagen) was collagen-treated (10 mg/mL) platelets and negative control (PRP/WP/resting) was untreated platelets. Data are mean ± SEM of five independent experiments. *P<0.05; **P<0.01; ***P<0.001 as compared with PRP/WP/resting (analysis of variance with Dunnett’s).
Abbreviations: CdTe, cadmium–telluride; flU, fluorescence unit; QD, quantum dot; PRP, platelet-rich plasma; SEM, standard error of the mean; WP, washed platelets.

Figure 2 Analysis of effect of CdTe QDs on platelet receptors by fluorescent microscopy.
Notes: Expression of P-selectin (A) or GPIIb-IIIa (B) receptors was analyzed in negatively charged 2.6 nm (g, h, i, s, t, u) or 4.8 nm (j, k, l, v, w, x) CdTe QD-induced platelet aggregates. Untreated WP (negative control: a, b, c, m, n, o) and collagen-treated platelets (positive control: d, e, f, p, q, r) served as controls. Samples were collected from aggregometer and then treated with P-selectin or PAC1 (against activated GPIIb-IIIa receptors) antibodies. Staining of actin cytoskeleton was done in resting and collagen-induced platelet aggregates but not in QD-induced platelet aggregates. Confocal images are representative of three independent experiments.
Abbreviations: Ab, antibody; CdTe, cadmium–telluride; GP, glycoprotein; QD, quantum dot; PRP, platelet-rich plasma; WP, washed platelets.
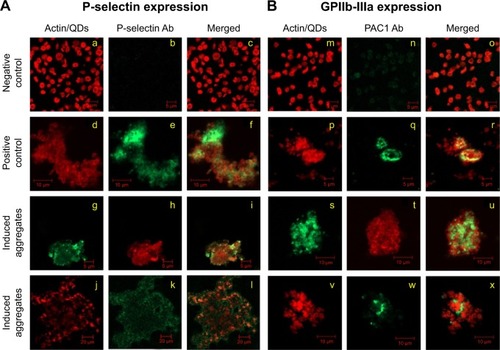
Figure 3 Zymography: detection and quantification of MMP-2 released from CdTe QD-activated platelets.
Notes: (A) MMP-2 gelatinase activity in the releasates of negatively charged (a) or positively charged (b) QD-activated platelets. Lanes: C (standard): releasates from HT1080 cells; C/QD: standard with 3 μM QD; R: releasate from resting (untreated) platelets; Coll: releasate from collagen-activated platelets; 1: releasate from platelets treated with 1 μM QD; 3: releasate from platelets treated with 3 μM QD; 5: releasate from platelets treated with 5 μM QD. Zymograms are representative of experiments carried out with samples from three different donors. (B) Quantitative data and statistical analysis of MMP-2 bands. Data are mean ± SEM of three independent experiments. *P<0.05 as compared with resting platelets (analysis of variance with Dunnett’s).
Abbreviations: CdTe, cadmium–telluride; MMP, matrix metalloproteinase; QD, quantum dot; RIU, relative intensity units; SEM, standard error of the mean.
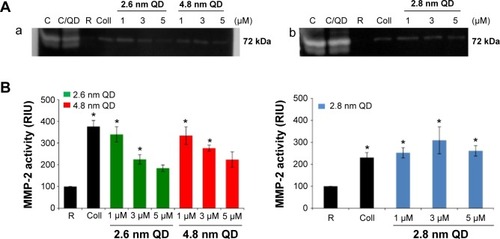
Figure 4 Association of QD agglomerates with platelets, as observed using transmission electron microscopy.
Notes: Washed platelets were treated with negatively charged 2.6 nm or 4.8 nm size CdTe QDs in optical aggregometer. Samples were fixed with glutaraldehyde at 20% aggregation in the aggregometer. After washing the platelet aggregates with phosphate-buffered saline, the samples were processed and subjected to transmission electron microscopy imaging. Negative control (A) was untreated resting platelets, and positive control (B) was collagen-induced aggregates; 2.6 nm (C) and 4.8 nm (D) QD-induced platelet aggregates are shown. Images are representative of three independent experiments. (a) α granules; (b) dense granules; (c) mitochondrion; (d) microtubules; (e) pseudopodia; (f) organelles concentrated in the center of the cytoplasm; (g) degranulatedintracellular granules; (h) 2.6 nm CdTe QDs; (i) 4.8 nm CdTe QDs.
Abbreviations: CdTe, cadmium–telluride; QD, quantum dot.
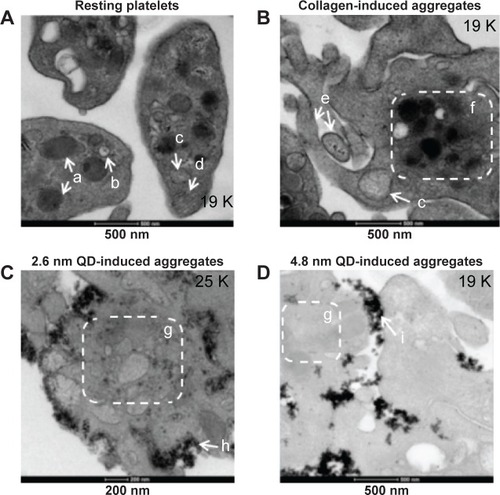
Figure 5 Inductions of platelet aggregation by CdTe QDs as measured by QCM-D.
Notes: Human platelet-poor plasma or platelet-rich plasma was treated with negatively charged 2.6 nm CdTe QDs and perfused over fibrinogen-coated QCM-D sensors. Frequency and dissipation were recorded in real time. Untreated PPP or PRP was taken as negative control. Frequency and dissipation values obtained from PPP (A, B) and PRP (C, D) are shown. Data are mean ± SEM of four independent experiments. *P<0.05, as compared with PRP.
Abbreviations: CdTe, cadmium–telluride; D, dissipation; F, frequency; QD, quantum dot; PPP, platelet-poor plasma; PRP, platelet-rich plasma; QCM-D, quartz crystal microbalance with dissipation; SEM, standard error of the mean.
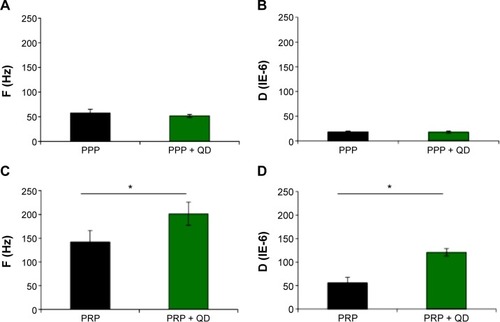
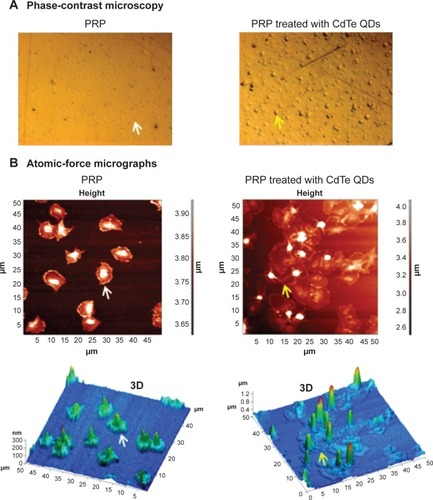
Figure 6 Phase-contrast and atomic-force micrographs of CdTe QD-induced platelet microaggregates on QCM-D crystals.
Notes: After measuring the frequency and dissipation, the quartz crystals with adhered platelet microaggregates were subjected to phase-contrast microscopy (A) or atomic-force microscopy (B). Platelets adhered on crystals perfused with untreated PRP were taken as controls. Individual platelets (white arrows) and platelet aggregates (yellow arrows) are shown. Three-dimensional images corresponding to height images are shown. Images are representative of three independent experiments.
Abbreviations: CdTe, cadmium–telluride; QD, quantum dot; PRP, platelet-rich plasma; QCM-D, quartz crystal microbalance with dissipation.