Figures & data
Figure 1 Three-dimensional schematic structure of C18GR7RGDS amphiphilic peptides.
Notes: Red, oxygen atoms; blue, nitrogen atoms; gray, carbon atoms; and white, hydrogen atoms.
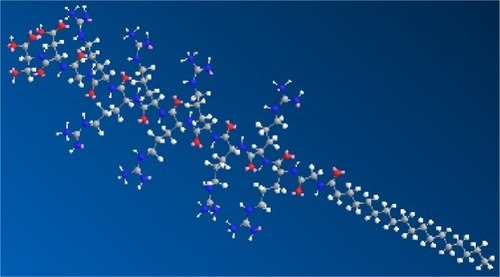
Figure 2 Transmission electron microscopic images of 1.5 mg/mL amphiphilic nanoparticles (indicated by arrows) prepared in different solutions.
Notes: (A) Deionized water, (B) phosphate-buffered saline (pH 7.4), (C) aggregates of amphiphilic nanoparticles without sonication, (D) acetic acid at pH 6, (E) acetic acid at pH 4, and (F) acetic acid at pH 2. Images were taken at 40,000–50,000× magnification.
Abbreviations: APNP, amphiphilic peptide nanoparticles; PBS, phosphate-buffered saline.
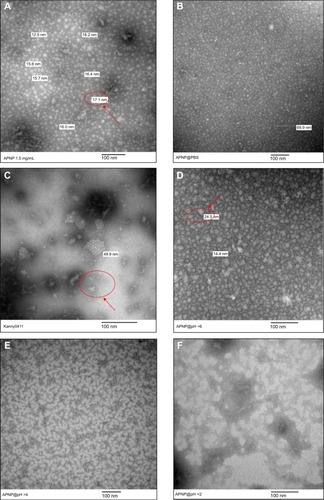
Figure 3 (A) Enhanced solubility of curcumin observed in a solution of curcumin-loaded amphiphilic nanoparticles (right) compared with solid insoluble curcumin in water (left). (B) Lyophilized powder of the resulting solution and (C) redissolution of the lyophilized powder in water.
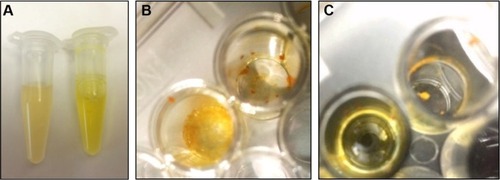
Figure 4 (A, B) Transmission electron microscopic images of a solution of curcumin-loaded amphiphilic nanoparticles (indicated by arrows) at 50,000× magnification (A and B).
Abbreviations: APNP, amphiphilic peptide nanoparticles.
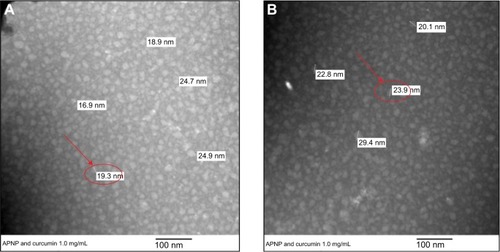
Figure 5 Zeta potential of pure APNPs and curcumin-loaded APNPs.
Abbreviation: APNPs, amphiphilic peptide nanoparticles.
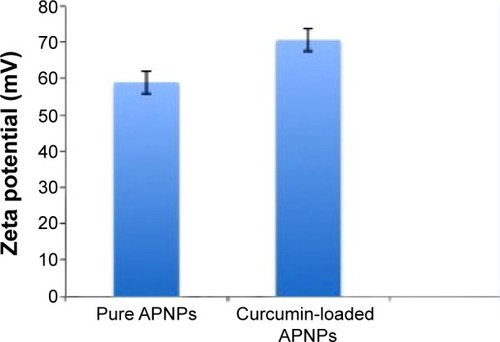
Figure 6 Fourier transform infrared spectra of (i) solid-state plain curcumin, (ii) pure amphiphilic nanoparticles, and (iii) curcumin-loaded amphiphilic nanoparticles.
Abbreviation: AU, absorbance units.
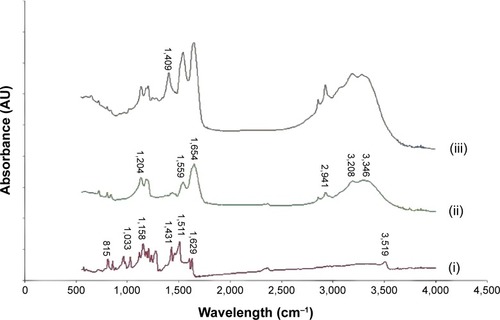
Figure 7 X-ray diffraction patterns of curcumin, pure APNPs, and curcumin-loaded APNPs.
Abbreviations: AU, absorbance units; APNPs, amphiphilic peptide nanoparticles.
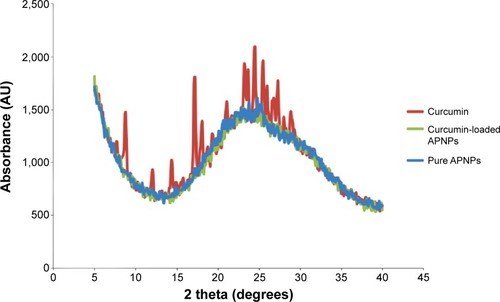
Figure 8 Bright field microscopic images of normal human osteoblast cells: (A) control, (B) treated with 20 μM of curcumin in phosphate-buffered saline, and (C) treated with 20 μM of curcumin encapsulated by amphiphilic nanoparticles. Bright field microscopic images of osteosarcoma cells: (D) control, (E) treated with 20 μM of curcumin in phosphate-buffered saline, and (F) treated with 20 μM of curcumin encapsulated by amphiphilic nanoparticles. Images were taken at a magnification of 20×.
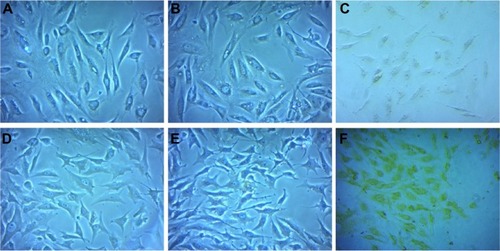
Figure 9 Confocal microscopic images of uptake for normal human osteoblast cells: (A) control, (B) treated with 20 μM of curcumin in phosphate-buffered saline, and (C) treated with 20 μM of curcumin encapsulated by amphiphilic nanoparticles. Confocal microscopic images of uptake for osteosarcoma cells: (D) control, (E) treated with 20 μM of curcumin in phosphate-buffered saline, and (F) treated with 20 μM of curcumin encapsulated by amphiphilic nanoparticles. Images were taken at a magnification of 10×.
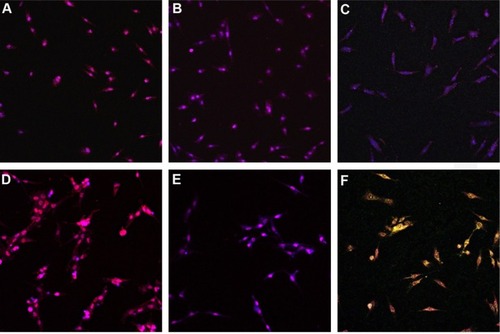
Figure 10 Cytotoxicity of pure APNP to HOB and OS cells. Cells were treated for 24 hours in serum-free medium.
Notes: The data are expressed as (A) cell viability and (B) cell density. The data are shown as the mean ± standard error of the mean of n=3 (five samples per group). P-values represent significant differences between the pure APNP-treated groups and the control groups. *P<0.01.
Abbreviations: APNPs, amphiphilic peptide nanoparticles; HOB, human osteoblasts; OS, osteosarcoma.
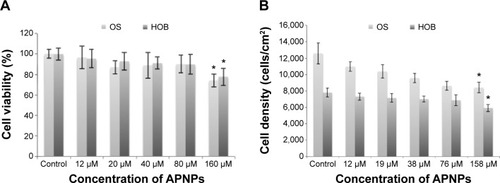
Figure 11 Cytotoxicity of curcumin-loaded APNPs, plain curcumin in PBS, and curcumin dissolved in DMSO to (A) OS cells and (B) healthy HOB cells. Cells were treated for 24 hours in serum-free medium.
Notes: The data are expressed as cell viability and shown as the mean ± standard error of the mean of n=3 (five samples per group). P-values represent significant differences between labeled groups with (*) the control groups, (#) the groups treated with the same concentration of plain curcumin in PBS, and (^) the groups treated by the same concentration of curcumin dissolved in DMSO. *,#,^P<0.01, **,##,^^P<0.005.
Abbreviations: DMSO, dimethyl sulfoxide; HOB, human osteoblasts; OS, osteosarcoma; PBS, phosphate-buffered saline; APNPs, amphiphilic peptide nanoparticles.
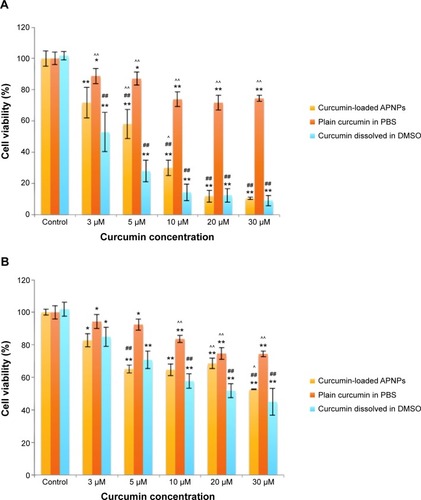
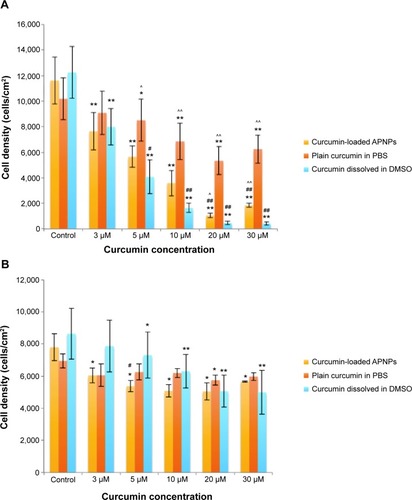
Figure 12 Cytotoxicity of curcumin-loaded APNPs, plain curcumin in PBS, and curcumin dissolved in DMSO to (A) osteosarcoma (OS) cells and (B) healthy human osteoblast (HOB) cells. Cells were treated for 24 hours in serum-free medium.
Notes: Data are expressed by cell densities. Data are shown as the mean ± standard error of the mean, n=3 (five samples per n). The P-values represent the significant differences between labeled groups with (*) the control groups, (#) groups treated by the same concentration of plain curcumin in PBS, and (^) groups treated by the same concentration of curcumin dissolved in DMSO. *,#,^P<0.01, **,##,^^P<0.005.
Abbreviations: DMSO, dimethyl sulfoxide; APNPs, amphiphilic peptide nanoparticles; PBS, phosphate-buffered saline.