Figures & data
Figure 1 Selected Quillaja saponin (QS) fractions, and their particulate forms. A) Reversed phase chromatography profile of QS. Fraction A (desacyl-saponin, DSAP) is the least hydrophobic QS fraction being the active saponin component in BBE particles. Fraction B (acyl-saponin, ASAP) is the most hydrophobic QS fraction being the active component in KGI particles. B) The triterpenoid structure of QS. The core is a triterpenoid with two carbohydrate chains in the position 3 and 18 and an acyl chain terminated with arabinose and rhamnose monosaccharides demarked with a ring in the Figure. C) Electron microscopic picture of KGI. BBE shows the same morphology. The diameter of the spheres is about 40 nm.
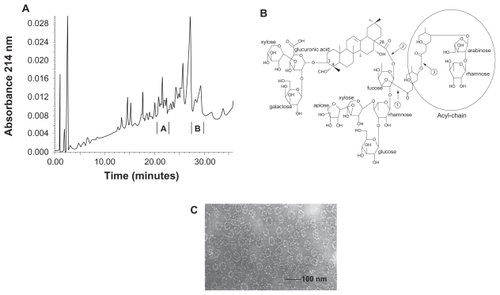
Figure 2 Free non-particulate ASAP causes early cell destruction but not the particulate form. A) Cell destruction measured by hemolytic effect. KGI and BBE are virtually non-lytic while free ASAP is highly lytic. B) Free ASAP induces early cell death in human normal monocytes like in cancer cells, but not the ASAP formulated into KGI particles measured by Trypan Blue staining. C) Free ASAP induces early cell death in U937 tumor cells within minutes at the concentrations indicated. KGI does not induce this rapid cell death. D) Cell membrane destruction measured by the release of the intracellular enzyme thymidine kinase (TK) to the extracellular medium. Free ASAP causes TK release, while KGI does not cause the leakage. E) Free ASAP causes cell necrosis but not KGI particles.
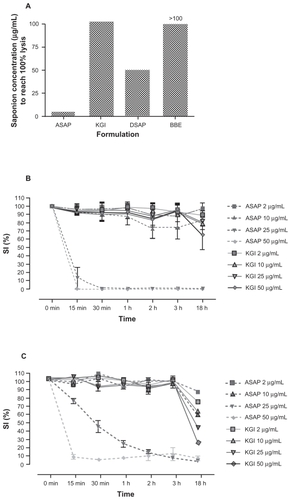
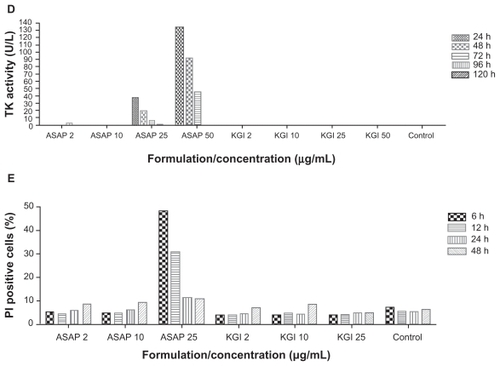
Figure 3 KGI kills preferentially cancer cells over normal cells with no recovery of residual cells while BBE blocks the killing effect of KGI. A) KGI induces cell death in U937 monoblast cancer cells at about 30-fold lower concentration than that required to kill normal monocytes derived immature DCs (mDC) measured by Alamar Blue method and expressed as IC50. B) The U937 cancer cells were synchronized in cell cycle and then cultured with 2 μg/mL of KGI for the first three days. The viable cells were counted at indicated time points. Even after a prolonged culture for 12 days there was no residual cancer cells treated with KGI reverting to replication. C) U937 cells were exposed to a fixed concentration of KGI (77 μg/mL) and increasing concentrations of BBE (X axis). As shown, close to 100% blocking by BBE was achieved when the ratio between BBE and KGI approaching 10 to 1.
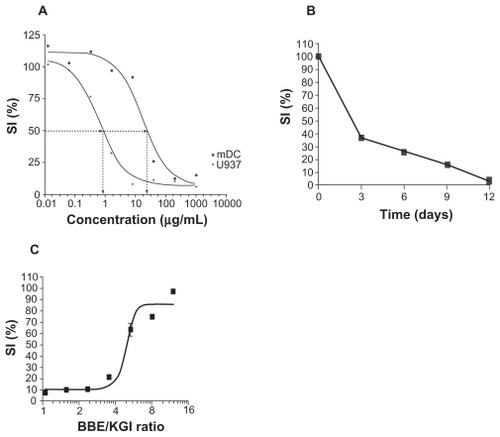
Table 2 Cytotoxic effect of KGI and BBE on different leukemia cell lines and normal cells measured after exposure for 24 hours expressed as IC50 (μg/mL)
Figure 4 KGI particles induce apoptosis in U937 cells demonstrated in various assays. A) Induction of apoptosis by free ASAP and KGI particles measured by Annexin V staining. B) Photomicrograph of control and KGI treated cells stained with apoptag and Hoechst 33342. C) Effect of KGI on DNA fragmentation. D) Caspase 3/7 activity using Arrayscan II as described in Material and Methods.
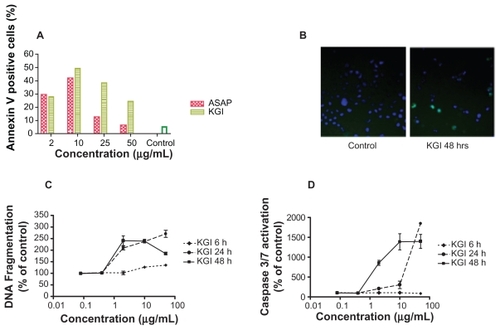
Figure 5 ASAP in free form and formulated into KGI inhibit thymidine kinase (TK) activity. The decreased level of TK caused by KGI correlates with reduced cell growth. Both KGI and BBE can induce cytokine production but only KGI kills the cells. A) Very low or no intracellular levels of TK activity was recorded in U937 cancer cells treated with 25 and 50 μg/mL of free ASAP and KGI respectively. B) The intracellular levels of TK decreased close to 50% compared to control cells after exposure of cells synchronized in the cell cycle to KGI particles for 24 hrs. C) The number of viable cells synchronized in the cell cycle was reduced to ¼ of that of control cells after exposure to KGI for 24 hrs. D) KGI stimulates U937 cancer cells to produce IL-8 with a sharp increase at the concentrations of 0.5 to 1 μg/mL close to the IC50 of KGI while BBE stimulates production of IL-8 without killing the cells.
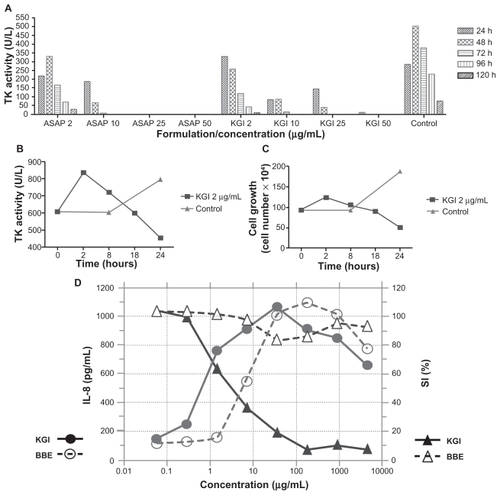
Table 1 KGI induces depletion of U937 cancer cells in the S-phase and accumulation in G1-phase of the cell cycle measured as proportion (%) of the total cell population
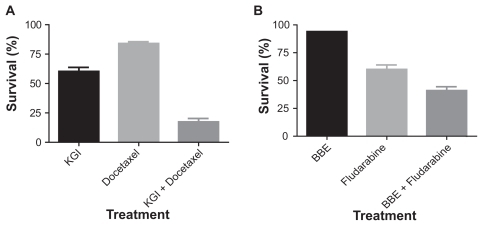
Figure 6 The synergistic effect of KGI and BBE with other anticancer drugs on U937 cells A) KGI (10 μg/mL) exerts a strong synergistic effect with Docetaxel (0.0016 μM) and B) BBE (10 μg/mL) with Fludarabine (2 μM).