Figures & data
Figure 1 Solubility of fenofibrate in aqueous solutions of various hydrophilic carriers.
Notes: Each value denotes the mean ± SD (n=3): (A) 1% (w/v) polymers and (B) 1% (w/v) surfactants.
Abbreviations: PVP, polyvinylpyrrolidone; HP-β-CD, hydroxypropyl-β-cyclodextrin; SD, standard deviation; HPC, hydroxypropyl cellulose; PVA, polyvinyl alcohol; HPMC, hydroxypropyl methylcellulose; CMC, carboxymethylcellulose; PEG, polyethylene glycol.
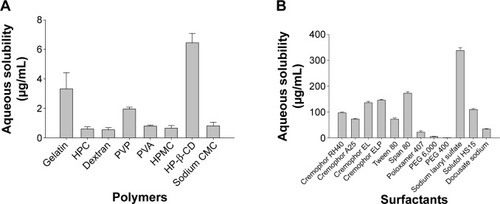
Figure 2 Effect of various nanoparticulated formulations on the aqueous solubility of fenofibrate.
Notes: Each value represents the mean ± SD (n=3): (a) fenofibrate powder, (b) PVP nanospheres, (c) HP-β-CD nanocorpuscles, and (d) gelatin nanocapsules. P<0.05 for each formulation compared to the drug powder.
Abbreviations: SD, standard deviation; PVP, polyvinylpyrrolidone; HP-β-CD, hydroxypropyl-β-cyclodextrin.
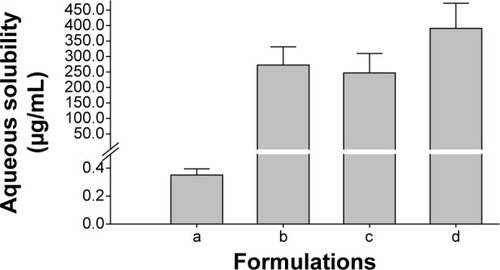
Figure 3 Effect of various nanoparticulated formulations on the dissolution of fenofibrate.
Notes: Each value shows the mean ± SD (n=6): (a) fenofibrate powder, (b) PVP nanospheres, (c) HP-β-CD nanocorpuscles, and (d) gelatin nanocapsules. P<0.05 for each formulation compared to the drug powder.
Abbreviations: SD, standard deviation; PVP, polyvinylpyrrolidone; HP-β-CD, hydroxypropyl-β-cyclodextrin.
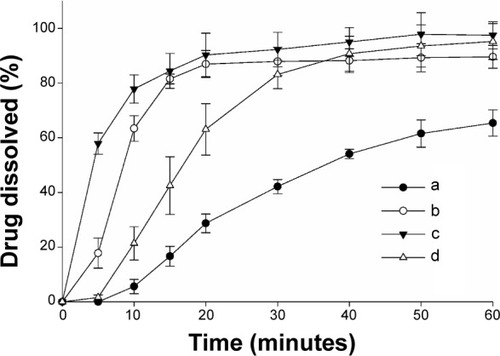
Figure 4 Solid state characterization.
Notes: (A) PXRD patterns, (B) DSC thermograms, and (C) FTIR spectrograms: (a) fenofibrate powder, (b) PVP nanospheres, (c) HP-β-CD nanocorpuscles, and (d) gelatin nanocapsules.
Abbreviations: PXRD, powder X-ray diffraction; DSC, differential scanning calorimetry; FTIR, Fourier-transform infrared; PVP, polyvinylpyrrolidone; HP-β-CD, hydroxypropyl-β-cyclodextrin.
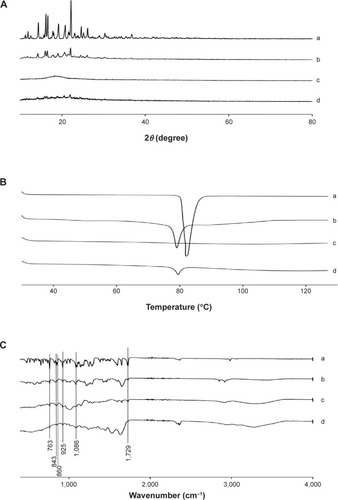
Figure 5 Scanning electron micrographs.
Notes: (A) Fenofibrate powder (×2,000), (B) PVP nanospheres (×20,000), (C) HP-β-CD nanocorpuscles (×20,000), and (D) gelatin nanocapsules (×20,000).
Abbreviations: PVP, polyvinylpyrrolidone; HP-β-CD, hydroxypropyl-β-cyclodextrin.
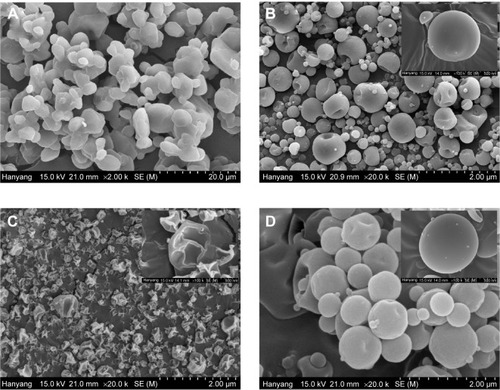
Table 1 Pharmacokinetic parameters
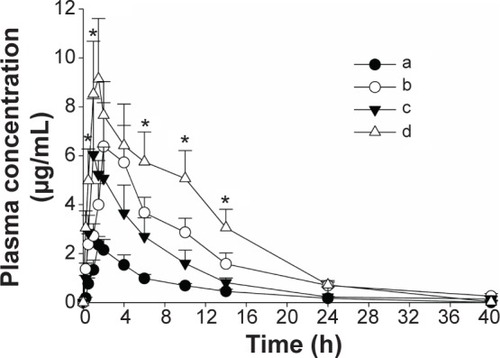
Figure 6 Mean plasma level–time profiles of fenofibric acid in rats after the oral administration of various formulations.
Notes: (a) Fenofibrate powder, (b) PVP nanospheres, (c) HP-β-CD nanocorpuscles, and (d) gelatin nanocapsules. Each dose was equivalent to 20 mg/kg fenofibrate. Each value designates the mean ± SD (n=6). At all of the time points, each fenofibrate-loaded nanoparticulated formulation showed P<0.05 compared to the drug powder. *P<0.05 for gelatin nanocapsules compared with the other formulations.
Abbreviations: PVP, polyvinylpyrrolidone; HP-β-CD, hydroxypropyl-β-cyclodextrin; SD, standard deviation.