Figures & data
Table 1 Characterization of nanodroplets without drug loading and the nanodroplet-encapsulated quercetin formulation by particle size, zeta potential, polydispersity index, and drug encapsulation
Figure 1 Percentage weight remaining in the NQ formulation as a function of time in the stability experiment in a 37°C oven and 4°C freezer. Each value represents the mean ± standard deviation (n=4).
Abbreviation: NQ, nanodroplet-encapsulated quercetin.
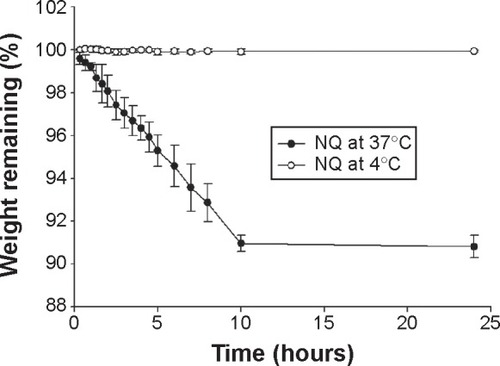
Figure 2 Transmission electron microscopic micrograph of the nanodroplet-encapsulated quercetin formulation. Original magnification 60,000×.
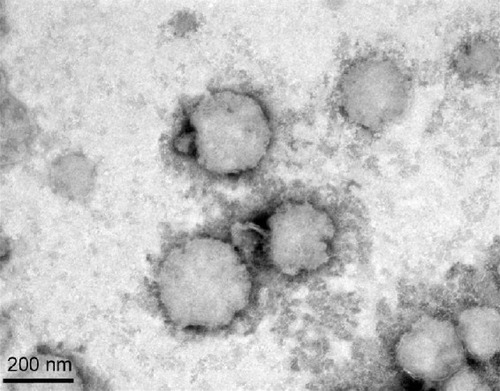
Figure 3 In vitro release profiles for quercetin over time across a cellulose membrane for a control solution of PEG 400 +20% ethanol and perfluorocarbon nanodroplets. A 0.5 mL plasma aliquot was added to the donor compartment of a Franz diffusion cell. Each value represents the mean ± standard deviation (n=3). *P<0.05 versus the quercetin group.
Abbreviations: NQ, nanodroplet-encapsulated quercetin; PEG, polyethylene glycol.
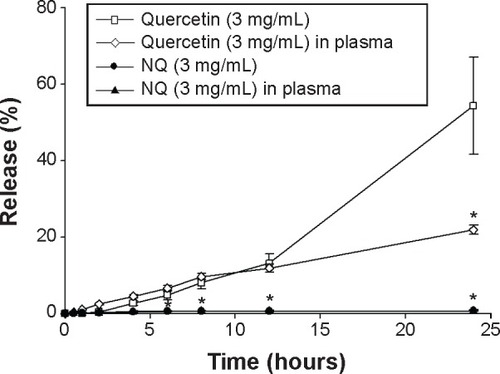
Figure 4 Effect of ultrasound at 1 MHz with an intensity of 2.0 W/cm2 and a duty cycle of 20% on in vitro release of quercetin from perfluorocarbon nanodroplets across a cellulose membrane. A 0.5 mL plasma aliquot was added to the donor compartment of the Franz diffusion cell. Each value represents the mean ± standard deviation (n=3). *P<0.05 versus the value for the NQ sample.
Abbreviation: NQ, nanodroplet-encapsulated quercetin.
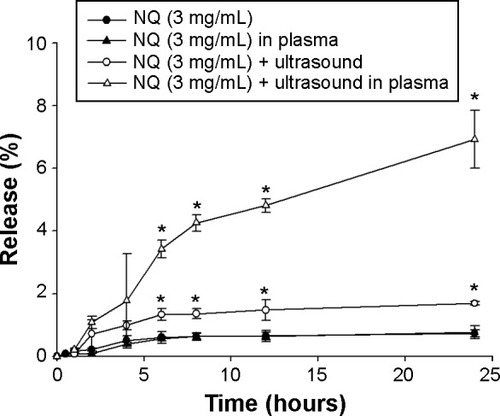
Figure 5 Ultrasonograph of the bladder in the normal rats.
Notes: (A) Preinjection, (B) injection of double-distilled H2O, and (C) injection of nanodroplets. Red-circled areas indicate monitoring region.
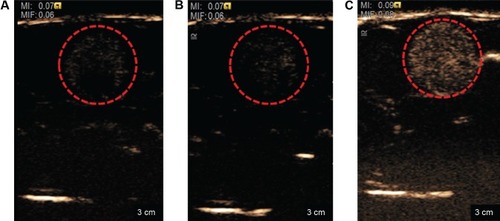
Figure 6 Ultrasonograph of nanodroplets inside the abdominal vein in a rat model.
Notes: (A) Before and (B) after intravenous administration of nanodroplets at 30 seconds. (C) nanobubbles triggered by ultrasonic treatment and (D) after triggering of nanobubbles. Red-circled areas indicate monitoring region.
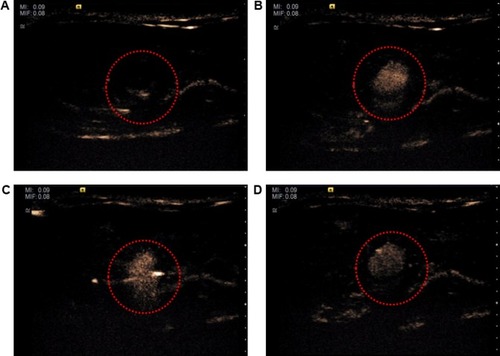
Table 2 Pharmacokinetic parameters of quercetin 3 mg/kg and the equivalent quercetin dose for the nanodroplet-encapsulated quercetin formulation in rat plasma after administration of an intravenous bolus
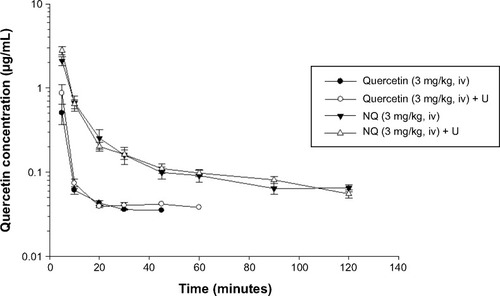
Figure 7 Concentration curve of quercetin in rat plasma after intravenous administration of quercetin 3 mg/kg, quercetin triggered with ultrasound at 3 minutes (quercetin + U, 3 mg/kg), NQ 3 mg/kg, and NQ triggered with ultrasound (NQ + U, 3 mg/kg) at 3 minutes, respectively (mean ± standard error of the mean; n=6).
Abbreviations: iv, intravenously; U, treatment with ultrasound; NQ, nanodroplet-encapsulated quercetin.