Figures & data
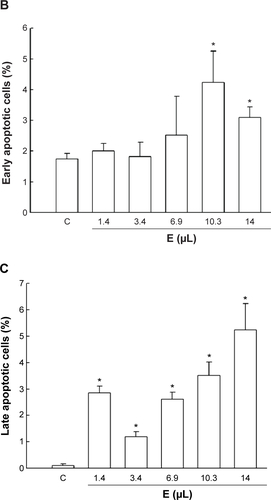
Figure 1 Characterization data of gold nanoparticles and lycopene–nanogold nanoemulsion, as determined by TEM, DLS, and UV–visible spectrophotometer.
Notes: (A) Gold nanoparticles; (B) lycopene–nanogold nanoemulsion. (Aa) TEM image of gold nanoparticles along with the particle size distribution histogram showing the mean particle size ± standard deviation in the range of 3.6–5.7 nm. (Ab) Particle size distribution as measured by DLS showing the mean particle size ± standard deviation (n=3). (Ac) UV–visible spectrum depicting the SPR peak of the gold nanoparticle. (Ba) TEM image of the lycopene–nanogold nanoemulsion in a negatively-stained background along with the particle size distribution histogram showing the mean particle size ± standard deviation in the range of 17.5–25.0 nm. (Bb) TEM image with reduced contrast of the (Ba) image to reveal the gold nanoparticles, which are seen as black dots around each nanoemulsion particle, as well as numerous scattered gold nanoparticles (some identified using black arrows). (Bc) Some enhanced TEM images of individual nanoemulsion particles (shown as dotted circles in Bb), illustrating gold nanoparticles as black dots necklacing each nanoemulsion particle. (Bd) Particle size distribution as measured by DLS showing the mean particle size ± standard deviation (n=3). (Be) UV–visible spectrum showing the SPR peak of gold nanoparticles, as well as the unique three-peak fine spectrum of lycopene.
Abbreviations: TEM, transmission electron microscopy; DLS, dynamic light scattering; UV, ultraviolet; n, number of replicates; SPR, surface plasmon resonance.
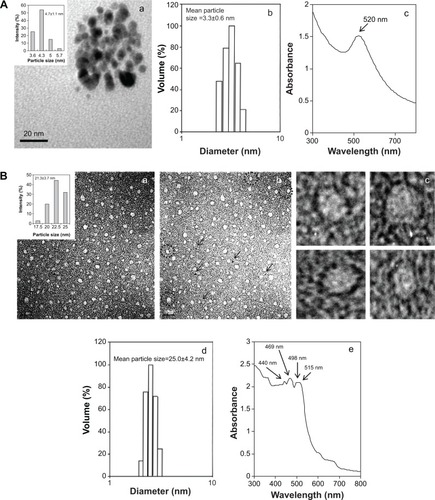
Figure 2 Dose effects of AN and LP, alone or in combination (AN+LP), and LP–nanogold nanoemulsion on the cytotoxicity of human colon adenocarcinoma HT-29 cells.
Notes: HT-29 cells were treated with (A) various doses of AN at various particle sizes (1–3 nm, 3–5 nm, and 10–15 nm) for 24 hours, (B) LP alone or in combination with AN (AN+LP), or (C) with the nanoemulsion for 24 hours. Cell viability was assessed by MTT assay. Values are presented as the mean ± SD (n=3–9). *P<0.05, the AN group compared to the control group. *P<0.05, the AN and LP alone compared with the untreated control. ⌾P<0.05, the AN+LP group compared to the LP group. #P<0.05, the AN+LP group compared to the AN group. §P<0.05, the NE (AN+LP) group compared to the AN+LP group.
Abbreviations: AN, gold nanoparticles; IC50, half maximal inhibitory concentration; LP, lycopene; SD, standard deviation; n, number of replicates; NE, nanoemulsion.
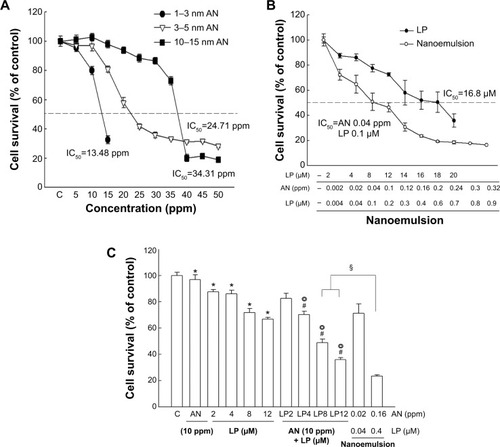
Figure 3 Effects of AN, LP, AN+LP, and nanoemulsion treatments on the apoptotic death of HT-29 cells.
Notes: HT-29 cells were cultured with the medium in the absence (control) and presence of AN, LP, AN+LP, nanoemulsion, and E at the various doses for 24 hours. (A) Representative microphotographs of apoptotic morphology (magnification: 200×; scale bar: 50 μm). (B) Representative quarterly plots of early apoptotic (AV-positive/PI-negative), late apoptotic (AV-positive/PI-positive), and necrotic cells (AV-negative/PI-positive) upon various treatments. Quantitative analysis of (C) early apoptotic (AV-positive/PI-negative) and (D) total apoptotic cells (AV-positive/PI-negative and -positive) upon various treatments. Values are presented as the mean ± SD (n=3–6). *P<0.05, the AN+LP or NE (AN+LP) group compared to the control group. §P<0.05, the NE (AN+LP) group compared to the AN+LP group.
Abbreviations: AN 10, gold nanoparticles 10 ppm; LP 12, lycopene 12 μM; NE, nanoemulsion; E, emulsion; PI, propidium iodide; AN, gold nanoparticles; LP, lycopene; AV, Annexin V; SD, standard deviation; n, number of replicates.
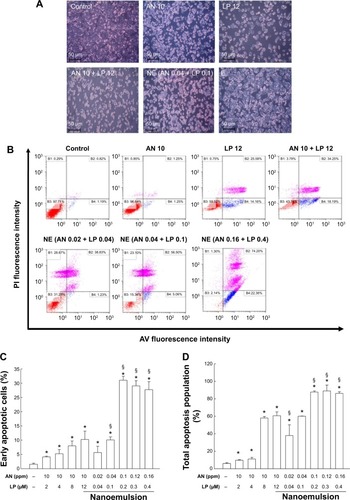
Figure 4 Effects of AN, LP, AN+LP, and nanoemulsion on procaspase 3, procaspase 8, and PARP-1 activation of HT-29 cells.
Notes: The representative Western blot image and quantitative analysis of the proenzyme levels of (A) procaspase 3, (B) procaspase 8, and (C) the target nuclear protein PARP-1 of HT-29 cells as affected by various treatments. HT-29 cells were cultured with the medium in the absence (control) and presence of AN, LP, AN+LP, nanoemulsion. Values are expressed as the mean ± SD (n=3). *P<0.05 compared to the control. §P<0.05 compared to the AN+LP group.
Abbreviations: AN, gold nanoparticles; LP, lycopene; SD, standard deviation; n, number of replicates.
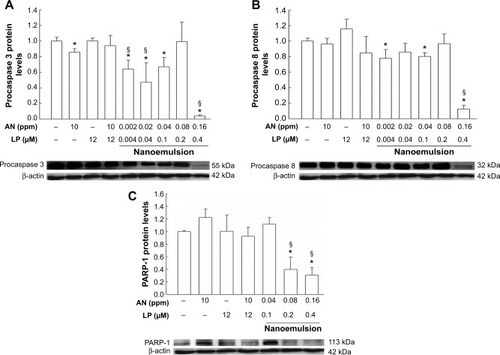
Figure 5 Effects of AN, LP, AN+LP, and nanoemulsion on the mitochondria-associated death signaling of HT-29 cells.
Notes: The representative Western blot image and quantitative analysis of (A) Bcl-2, (B) Bax, and (C) procaspase 9 protein levels were analyzed in HT-29 cells in the various treated groups. HT-29 cells were cultured with the medium in the absence (control) and presence of AN, LP, AN+LP, nanoemulsion. Values are expressed as the mean ± SD (n=3). *P<0.05 compared to the control. ⌾P<0.05, the AN+LP group compared to the LP group. §P<0.05, compared to the AN+LP group. #P<0.05, the AN+LP group compared to the AN group.
Abbreviations: AN, gold nanoparticles; LP, lycopene; SD, standard deviation; n, number of replicates.
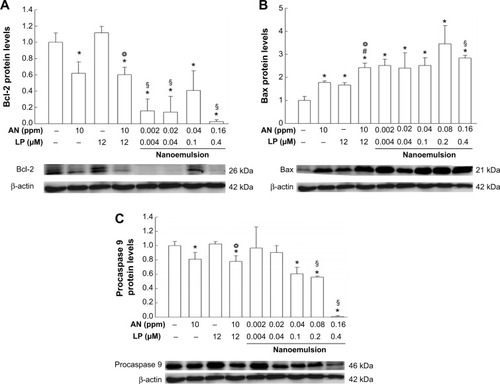
Figure 6 Effect of the AN, LP, AN+LP, and nanoemulsion on the wound healing migration of HT-29 cells.
Notes: HT-29 cells were wounded and incubated with untreated (controls) and treated groups (AN, LP, AN+LP, NE) at various doses. The (A) representative image photographs and (B–F) quantitative data are presented. The closed area in photographs represents the portion selected for quantification and the calculated percentage of migrated cells compared to control is shown in (B–F). Values are expressed as the mean ± SD (n=3). *P<0.05 as compared to the control. #P<0.05, the AN group compared to LP group and the LP group compared to AN+LP group.
Abbreviations: AN, gold nanoparticles; h, hours; LP, lycopene; AN 10, gold nanoparticles 10 ppm; LP 12, lycopene 12 μM; E, emulsion; NE, nanoemulsion; SD, standard deviation; n, number of replicates.
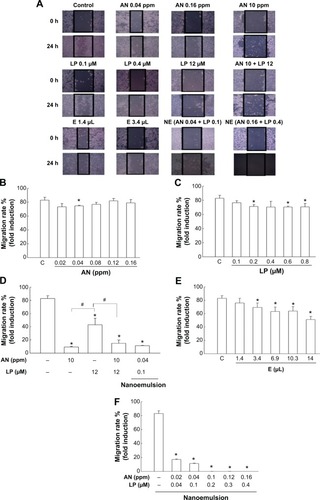
Figure 7 Expressions of the migration and invasion-associated signaling of HT-29 cells treated with AN, LP, AN+LP, and nanoemulsion at various doses.
Notes: The representative Western blot data and quantitative analysis of the expressions of (A) E-cadherin, (B) Vimentin, (C) β-catenin, (D) Akt, and (E) NFkB signal molecules are presented. HT-29 cells were cultured with the medium in the absence (control) and presence of AN, LP, AN+LP, nanoemulsion. Values are expressed as the mean ± SD (n=3). *P<0.05 compared to the control. #P<0.05 compared to the AN or LP or AN+LP group.
Abbreviations: AN, gold nanoparticles; LP, lycopene; NFkB, nuclear factor kappa B; SD, standard deviation; n, number of replicates.
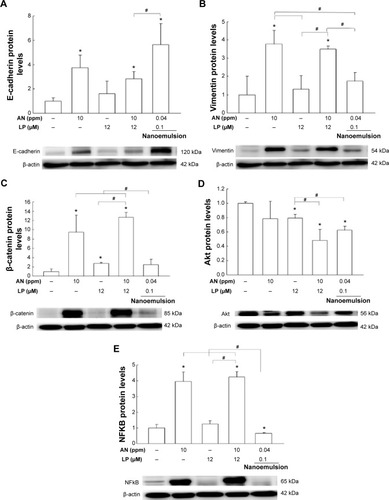
Figure 8 Expressions of MMP-2 and MMP-9 proteins in HT-29 cells as affected by various treatments.
Notes: The representative Western blot data of (A) MMP-2 and (D) MMP-9 of the control and various treatment groups along with the quantitative analysis of (B) pro-MMP-2, (C) active MMP-2, and (E) active MMP-9 are shown. Values are expressed as the mean ± SD (n=3). *P<0.05 compared to the control.
Abbreviations: MMP, matrix metalloproteinase; C, control; AN, gold nanoparticles; LP 12, lycopene 12 μM; LP, lycopene; SD, standard deviation; n, number of replicates.
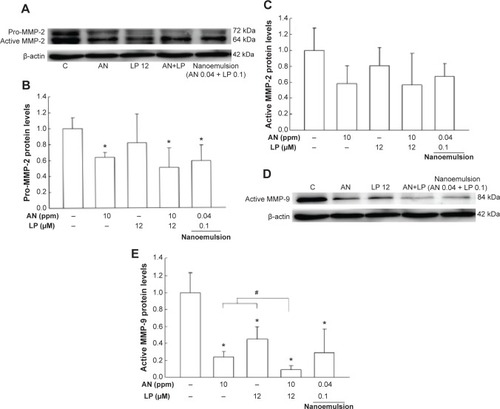
Figure 9 TEM images of the cellular uptake of HT-29 cells as affected by various treatments.
Notes: (A) (a and b) Control representing the untreated HT-29 cell. (B) Treatment with 10 ppm of AN. (C) (a–d) Combo treatment containing 10 ppm of AN plus 12 μM of LP. (D) (a–d) Nanoemulsion treatment containing different levels of AN and LP including AN 0.04 ppm + LP 0.1 μM (Da and Dc) and AN 0.16 ppm + LP 0.4 μM (Db and Dd). (Cb, Cc, and Db) The white arrows indicate nuclear envelope folds engulfing the vacuoles containing the AN+LP combo or nanoemulsion containing AN+LP.
Abbreviations: CY, cytoplasm; NU, nucleus; NS, nucleolus; VA, vacuoles; PMF, plasma membrane filaments; EU, euchromatin; NDME, nuclear double layer membrane; MC, mitochondria; AN, gold nanoparticle; LCR, loss of cristae seen as white portions inside the mitochondria; EM, abnormally elongated mitochondria; FM, formation of fused mitochondria; TEM, transmission electron microscopy; LP, lycopene.
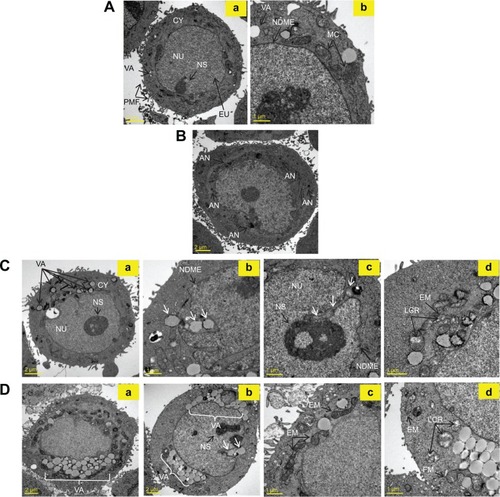
Figure S1 Representative microphotographs of MRC-5 cells exposed to AN (10 ppm), LP (12 μM), AN+LP (10 ppm, 12 μM), nanoemulsion (AN 0.16 ppm + LP 0.4 μM), and blank E (1.4 μL).
Notes: Magnification: 200×; scale bar: 50 μm.
Abbreviations: AN, gold nanoparticles; LP, lycopene; E, emulsion.
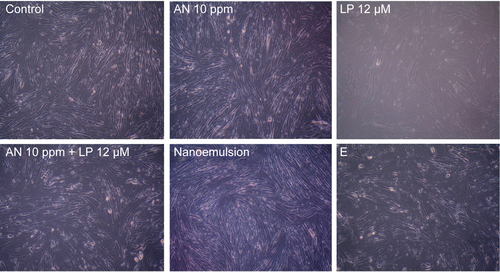
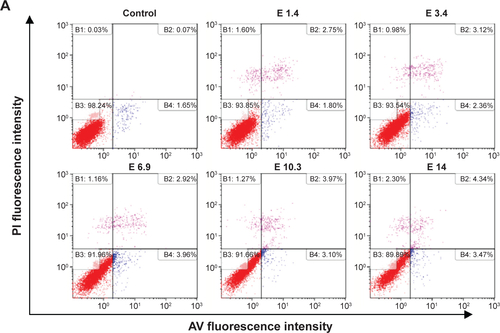
Figure S2 Effects of the blank emulsion particles on the apoptotic death of HT-29 cells.
Notes: Cells were treated with various doses of emulsions (1.4 μL/mL, 3.4 μL/mL, 6.9 μL/mL, 10.3 μL/mL, and 14 μL/mL medium) without AN and LP for 24 hours. A dose of 1.4 μL of emulsion was the same volume as the nanoemulsion containing AN at 0.16 ppm and LP at 0.4 μM. (A) Representative quarterly plots of apoptotic and necrotic cell death and (B) quantitative analysis of early apoptotic (AV-positive/PI-negative) and (C) late apoptotic cells (AV-positive/PI-positive). Apoptotic death was measured by AV and PI staining following the flow cytometric analysis. Values are presented as the mean ± SD (3 -9 independent experiments). *P<0.05, the blank nanoemulsion group compared to the control group.
Abbreviations: PI, propidium iodide; E, emulsion; C, control; AN, gold nanoparticles; LP, lycopene; AV, Annexin V; SD, standard deviation.