Figures & data
Figure 1 Characterization and biocompatibility of GT/PCL nanofibrous membrane.
Notes: (A) Gross view of the sheet of electrospun GT/PCL nanofibrous membrane. (B) SEM image of GT/PCL membrane. (C) Morphology of Passage 1 chondrocytes using a light microscope. Scale bar: 200 μm. (D) Morphology of chondrocytes on GT/PCL membranes after 2 days of cell culture in vitro. (E) Morphology of Passage 2 BMSCs using a light microscope. Scale bar: 200 μm. (F) Morphology of BMSCs on GT/PCL membranes after 2 days of cell culture in vitro.
Abbreviations: GT/PCL, gelatin/polycaprolactone; SEM, scanning electron microscopic; BMSC, bone marrow stromal cell.
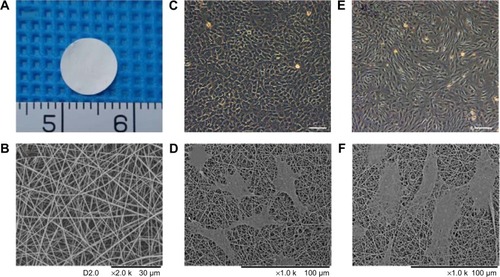
Figure 2 Engineering cell-scaffold constructs in vitro and the formation of cartilage in vivo.
Notes: (A) Gross view of cell-scaffold constructs engineered in the sandwich model in vitro. (B) Cell-scaffold constructs were implanted subcutaneously into nude mice after being cultured for 1 week in vitro. (C) Gross view of cell-scaffold constructs 12 weeks postimplantation. (D–F) Gross view of constructs 12 weeks postimplantation in the chondrocyte group, coculture group, and BMSC group, respectively. Minimum scale: 1 mm.
Abbreviation: BMSC, bone marrow stromal cell.
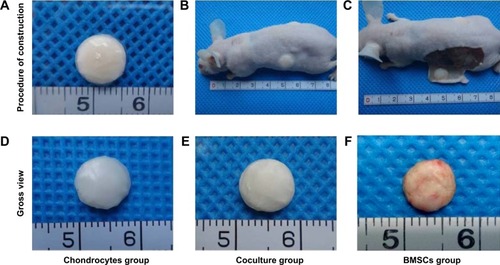
Figure 3 Quantitative analysis of thickness, wet weight, GAG content, and Young’s modulus.
Notes: (A) Average thicknesses of cell-scaffold constructs in the chondrocyte group, coculture group, and BMSC group, respectively. (B) Average wet weights of cell-scaffold constructs in the different groups. (C) GAG content normalized to wet weight for cell-scaffold constructs in the different groups. Rabbit auricular cartilages were used as a normal control. (D) Young’s modulus of cell-scaffold constructs in the different groups. The rabbit auricular cartilages were used as a normal control. Mean ± SD (n=4); *P<0.05, **P<0.01.
Abbreviations: GAG, glycosaminoglycan; BMSC, bone marrow stromal cell; SD, standard deviation.
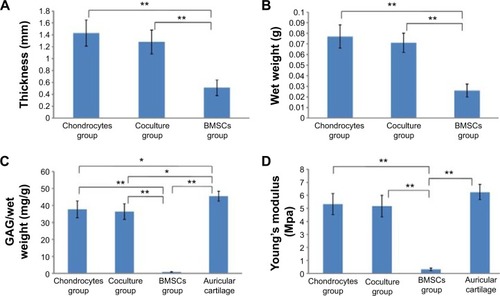
Figure 4 Histology of cell-scaffold constructs after 12 weeks in vivo in the different groups.
Notes: Tissue sections were stained with H&E. Arrows show nondegraded GT/PCL nanofibrous membranes. Scale bars: 200 μm.
Abbreviations: H&E, hematoxylin and eosin; BMSC, bone marrow stromal cell; GT/PCL, gelatin/polycaprolactone.
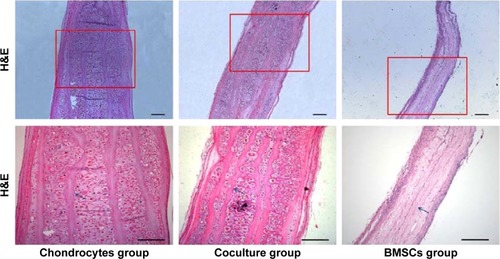
Figure 5 Special histological staining with Toluidine blue and Safranin O and immunohistochemistry staining with type 11 collagen for cell-scaffold constructs in the different groups.
Note: Scale bars: 200 μm.
Abbreviation: BMSC, bone marrow stromal cell.
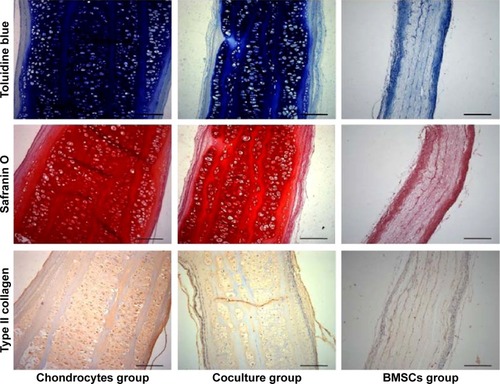
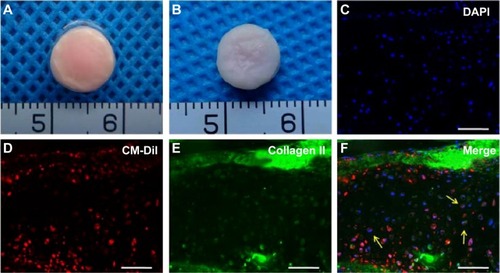
Figure 6 Labeling and tracing chondrogenesis of BMSCs.
Notes: (A) Gross view of cell-scaffold constructs formed by GT/PCL membranes seeded with coculture CM-Dil-labeled BMSCs and chondrocytes in vitro. (B) Gross view of cell-scaffold constructs after 12 weeks of implantation in the coculture group. (C–F) Immunofluorescence staining with type II collagen. Arrows show CM-Dil-labeled BMSCs overlapped with the type II collagen-positive cells in the constructs. Scale bars: 200 μm.
Abbreviations: DAPI, 4′,6-diamidino-2-phenylindole; BMSC, bone marrow stromal cell; GT/PCL, gelatin/polycaprolactone.