Figures & data
Figure 1 Synthesis scheme of block copolymer MPEG-b-PCL.
Abbreviations: CL, caprolactone; MPEG, methoxy poly(ethylene glycol); MPEG-b-PCL, methoxy poly(ethylene glycol)-b-poly(ε-caprolactone); Sn(Oct)2, stannous octoate.
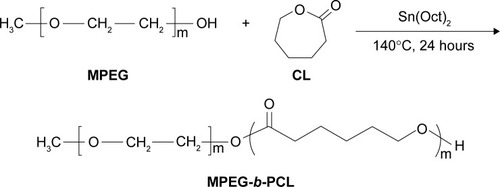
Figure 2 Typical 1H-NMR spectra of block copolymer MPEG-b-PCL.
Notes: 1H-NMR in CDCl3 was used, with following results: peak a (δ=4.06 parts per million [ppm], CL repeating unit: –CO–CH2–CH2–CH2–CH2–CH2–O–), b (δ=2.32 ppm, CL repeating unit: –CO–CH2–CH2–CH2–CH2–CH2–O–), c (δ=1.62–1.67 ppm, CL repeating unit: –CO–CH2–CH2–CH2–CH2–CH2–O–), and d (δ=1.38 ppm, CL repeating unit: –CO–CH2–CH2–CH2–CH2–CH2–O–). Peak e is the solvent CDCl3. The peak f at 3.65 ppm was assigned to the (–CH2–CH2) protons of the initiator MPEG.
Abbreviations: 1H-NMR, proton nuclear magnetic resonance; MPEG, methoxy poly(ethylene glycol); MPEG-b-PCL, methoxy poly(ethylene glycol)-b-poly(ε-caprolactone); ppm, parts per million.
![Figure 2 Typical 1H-NMR spectra of block copolymer MPEG-b-PCL.Notes: 1H-NMR in CDCl3 was used, with following results: peak a (δ=4.06 parts per million [ppm], CL repeating unit: –CO–CH2–CH2–CH2–CH2–CH2–O–), b (δ=2.32 ppm, CL repeating unit: –CO–CH2–CH2–CH2–CH2–CH2–O–), c (δ=1.62–1.67 ppm, CL repeating unit: –CO–CH2–CH2–CH2–CH2–CH2–O–), and d (δ=1.38 ppm, CL repeating unit: –CO–CH2–CH2–CH2–CH2–CH2–O–). Peak e is the solvent CDCl3. The peak f at 3.65 ppm was assigned to the (–CH2–CH2) protons of the initiator MPEG.Abbreviations: 1H-NMR, proton nuclear magnetic resonance; MPEG, methoxy poly(ethylene glycol); MPEG-b-PCL, methoxy poly(ethylene glycol)-b-poly(ε-caprolactone); ppm, parts per million.](/cms/asset/9c762ad7-9f68-46bc-8364-2d98c3f57f65/dijn_a_79605_f0002_c.jpg)
Figure 3 Schematic representation of the preparation techniques of PTX-loaded NPs and PTX-loaded NPs@PDA.
Abbreviations: NP, nanoparticle; PDA, polydopamine; PTX, paclitaxel; PTX-loaded NPs@PDA, PTX-loaded methoxy poly(ethylene glycol)-b-poly(ε-caprolactone) (MPEG-b-PCL) NPs that had their surfaces modified with PDA; TPGS, d-α-tocopheryl polyethylene glycol 1000 succinate.
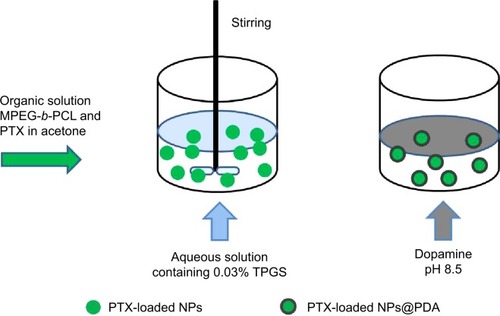
Table 1 Characterization of PTX-loaded NPs and PTX-loaded NPs@PDA
Figure 4 (A) DLS size distribution and (B) FESEM images of PTX-loaded MPEG-b-PCL NPs@PDA.
Abbreviations: DLS, dynamic light scattering; FESEM, field-emission scanning electron microscopy; NP, nanoparticle; PDA, polydopamine; PTX, paclitaxel; PTX-loaded MPEG-b-PCL NPs@PDA, PTX-loaded methoxy poly(ethylene glycol)-b-poly(ε-caprolactone) NPs that had their surfaces modified with PDA.
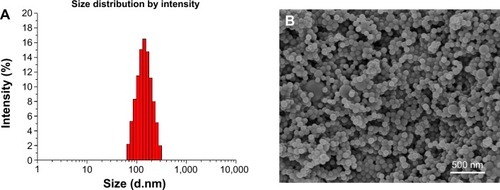
Figure 5 The in vitro drug release profile of PTX-loaded NPs and PTX-loaded NPs@PDA.
Note: Data represent mean ± SEM (n=3).
Abbreviations: NP, nanoparticle; PDA, polydopamine; PTX, paclitaxel; PTX-loaded NPs@PDA, PTX-loaded NPs that had their surfaces modified with PDA; SEM, standard error of the mean.
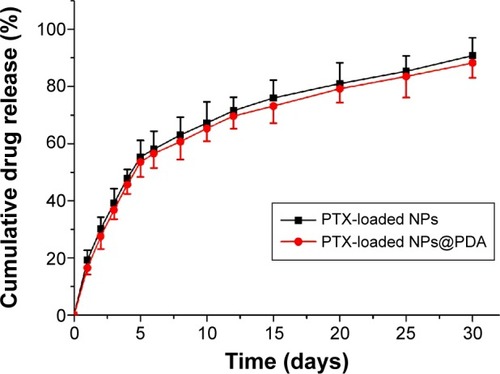
Figure 6 CLSM images of A875 cells after 2-hour incubation with C6-loaded NPs and C6-loaded NPs@PDA.
Notes: The NPs and NPs@PDA were green (EGFP channel) and the cells were blue (stained by DAPI).
Abbreviations: C6, coumarin-6; CLSM, confocal laser scanning microscopy; DAPI, 4′,6-diamidino-2-phenylindole dihydrochloride; EGFP, enhanced green fluorescent protein; NP, nanoparticle; NPs@PDA, NPs that had their surfaces modified with PDA; PDA, polydopamine.
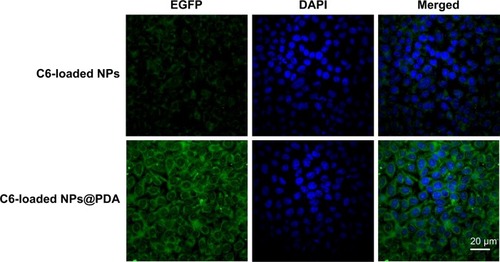
Figure 7 The cellular uptake efficiency of C6-loaded NPs and C6-loaded NPs@PDA at different NP concentrations.
Note: Data represent mean ± SEM (n=3; *P<0.05).
Abbreviations: C6, coumarin-6; NP, nanoparticle; NPs@PDA, NPs that had their surfaces modified with PDA; PDA, polydopamine; SEM, standard error of the mean.
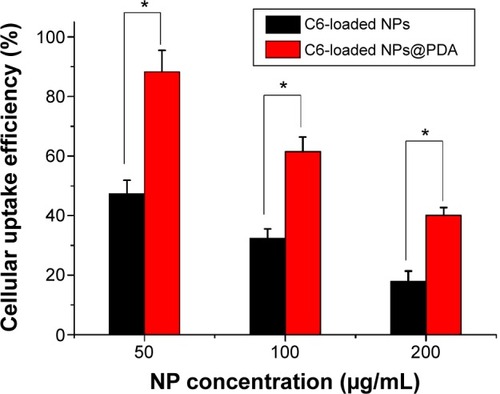
Figure 8 Viability of A875 cells after incubation with PTX-loaded NPs and PTX-loaded NPs@PDA in comparison with viability after treatment with Taxol® at the same PTX dose and drug-free NPs@PDA with the same amount of nanoparticles.
Notes: Incubation for (A) 12 hours; (B) 24 hours; and (C) 48 hours. Data represent mean ± SEM (n=3; *P<0.05, **P<0.01, ***P<0.001).
Abbreviations: NP, nanoparticle; NPs@PDA, NPs that had their surfaces modified with PDA; PDA, polydopamine; PTX, paclitaxel; SEM, standard error of the mean.
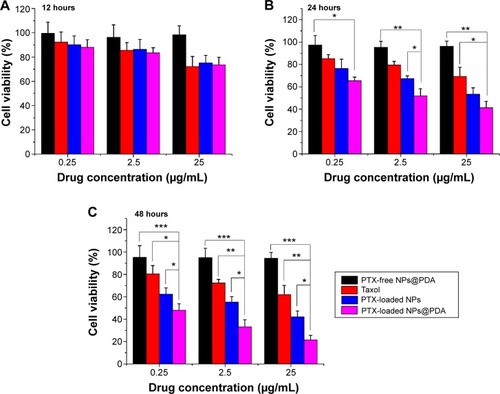
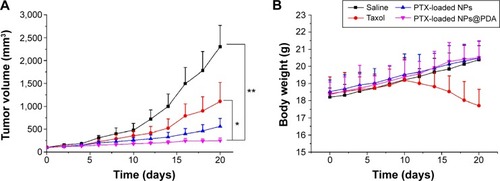
Figure 9 Tumor growth curve and weights of nude mice bearing A875 cell xenografts.
Notes: (A) Tumor growth curve of nude mice bearing A875 cell xenografts after injection with PTX-loaded NPs, PTX-loaded NPs@PDA, Taxol®, and saline; (B) weights of the nude mice bearing A875 cell xenografts after injection with PTX-loaded NPs, PTX-loaded NPs@PDA, Taxol®, and saline. Data represent mean ± SEM (n=5; *P<0.05, **P<0.01).
Abbreviations: NP, nanoparticle; NPs@PDA, NPs that had their surfaces modified with PDA; PDA, polydopamine; PTX, paclitaxel; SEM, standard error of the mean.