Figures & data
Table 1 Parameters of synthesized M-HFn nanoparticles with different core sizes
Figure 1 TEM analysis of M-HFn nanoparticles.
Notes: (A) TEM graphs of M-HFn1000, M-HFn3000, M-HFn5000, and M-HFn7000. Scale bar is 10 nm. (B) The high-resolution TEM images of these four M-HFn samples. Scale bar is 1 nm. (C) Corresponding SAED patterns of M-HFn nanoparticles. (D) Size histograms of M-HFn nanoparticles.
Abbreviations: M-HFn, ferrimagnetic H-ferritin; TEM, transmission electron microscope; SAED, selected area electron diffraction.
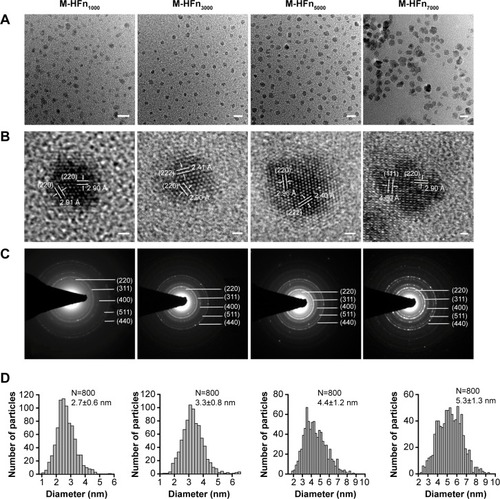
Figure 2 Native PAGE analysis of assembled HFn cage structure of M-HFn nanoparticles.
Notes: Gel was stained with (A) potassium ferrocyanide and (B) Coomassie Brilliant Blue R250. Lane 1, HFn cage; lane 2, M-HFn1000; lane 3, M-HFn3000; lane 4, M-HFn5000; and lane 5, M-HFn7000. (C) CD spectra determination of the secondary protein structural stability of M-HFn nanoparticles.
Abbreviations: HFn, H chain ferritin; M-HFn, ferrimagnetic H-ferritin; PAGE, polyacrylamide gel electrophoresis; CD, circular dichroism; PBS, phosphate-buffered saline.
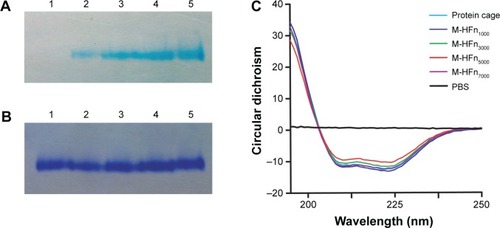
Figure 3 Size dependence of magnetic properties of M-HFn nanoparticles.
Notes: The relationship between the core size of M-HFn nanoparticles and their (A) R-value, (B) Ms, and (C) Hc.
Abbreviations: M-HFn, ferrimagnetic H-ferritin; Ms, saturation magnetization; Hc, coercivity; R, magnetostatic interaction parameter.
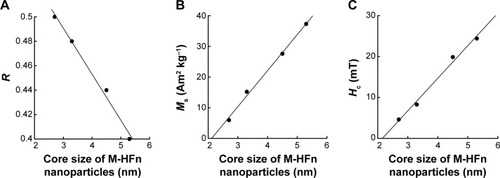
Figure 4 Peroxidase-like activity assays of M-HFn nanoparticles.
Notes: M-HFn nanoparticles with different sizes of core catalyzed the oxidation of peroxidase substrates in the presence of H2O2. (A) TMB as the substrate to give a deep blue color product. (B) DAB as the substrate to give a deep brown color product. Color intensity changes with (a) HFn cage, (b) M-HFn1000, (c) M-HFn3000, (d) M-HFn5000, and (e) M-HFn7000. (C) The peroxidase-like activity of M-HFn nanoparticle is size dependent; larger M-HFn nanoparticles show higher peroxidase-like activity (TMB as the substrate).
Abbreviations: HFn, H chain ferritin; M-HFn, ferrimagnetic H-ferritin; TMB, 3,3′,5,5′-tetramethylbenzidine; DAB, 3,3′-diaminobenzidine tetrahydrochloride.
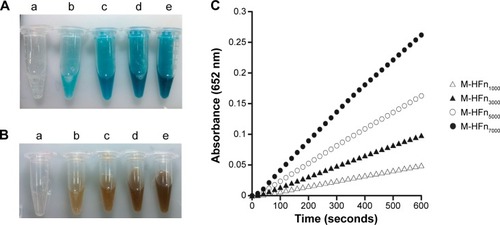
Figure 5 MRI of MDA-MB-231 tumor cells incubated with M-HFn nanoparticles.
Notes: (A) Evaluation of the efficiency of M-HFn nanoparticles in detecting MDA-MB-231 tumor cells by MRI. T2-weighted MR images of (a) tumor cell-only, and tumor cells incubated with (b) M-HFn1000, (c) M-HFn3000, (d) M-HFn5000, and (e) M-HFn7000. T2 values are 122.5±0.7 ms, 110.9±1.5 ms, 99.1±1.9 ms, 90.0±3.1 ms, and 81.2±2.6 ms (P<0.05, n=3). (B) T2-weighted MR images of tumor cells of different concentrations incubated with M-HFn7000 nanoparticles: (g) 0 cells mL−1, (h) 1×10⁴ cells mL−1, (i) 1×10⁵ cells mL−1, (j) 2×10⁵ cells mL−1, and (k) 3×10⁵ cells mL−1. T2 values are 140.4±3.7 ms, 103.2±0.4 ms, 93.2±0.8 ms, 88.8±0.8 ms, and 81.2±2.6 ms (P<0.05, n=3).
Abbreviation: M-HFn, ferrimagnetic H-ferritin; MR, magnetic resonance; MRI, magnetic resonance imaging.
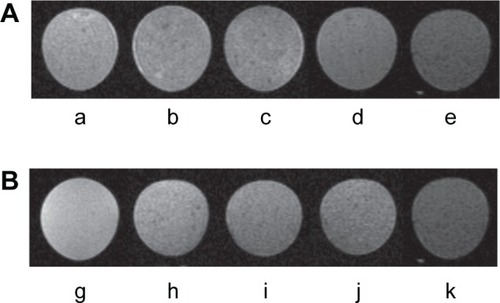
Figure 6 Iron uptake analysis of MDA-MB-231 tumor cells incubated with M-HFn nanoparticles.
Notes: Prussian blue staining of MDA-MB-231 tumor cells incubated for 24 hours with (A) no nanoparticles, (B) M-HFn1000, (C) M-HFn3000, (D) M-HFn5000, and (E) M-HFn7000. (F) Iron contents in single cell are 0.16 pg cell−1, 0.29 pg cell−1, 0.80 pg cell−1, and 1.23 pg cell−1 after incubation with M-HFn1000, M-HFn3000, M-HFn5000, and M-HFn7000, respectively, for 24 hours (statistical comparison of iron contents in single cell with cell-only yielded P=0.014, 0.002, 0.011, and 0.023 for M-HFn1000, M-HFn3000, M-HFn5000, and M-HFn7000, respectively).
Abbreviation: M-HFn, ferrimagnetic H-ferritin.
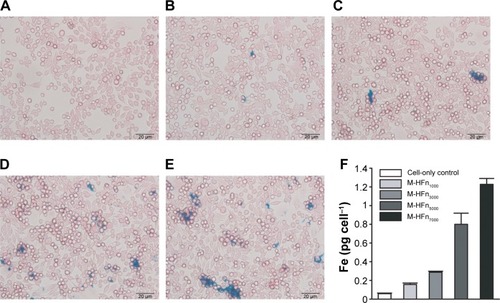
Figure 7 Representative images of immunohistochemical staining of MDA-MB-231 tumor tissues by incubating with M-HFn nanoparticles (DAB as the substrate).
Notes: (A) Without M-HFn nanoparticle incubation. Incubated with (B) M-HFn1000, (C) M-HFn3000, (D) M-HFn5000, and (E) M-HFn7000. (F) Different density mean shows that the tissue sections treated with M-HFn nanoparticles of larger core sizes enhance the efficiency of immunohistochemical staining (P<0.05).
Abbreviations: M-HFn, ferrimagnetic H-ferritin; DAB, 3,3′-diaminobenzidine tetrahydrochloride.
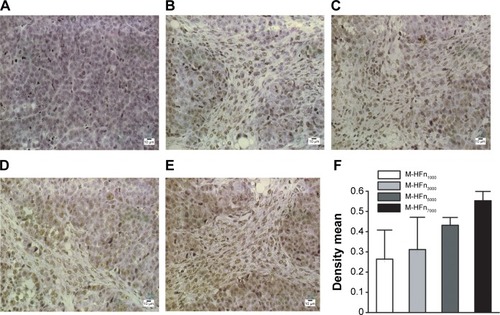
Figure S1 Magnetostatic interaction analysis of M-HFn nanoparticles.
Notes: The Wohlfarth–Cisowski test curves of (A) M-HFn1000, (B) M-HFn3000, (C) M-HFn5000, and (D) M-HFn7000 at 5 K. R values are 0.5, 0.48, 0.44, and 0.40 for M-HFn1000, M-HFn3000, M-HFn5000, and M-HFn7000, respectively.
Abbreviations: M-HFn, ferrimagnetic H-ferritin; IRM, isothermal remanent magnetization; H, applied magnetic field; DCD, direct current field demagnetization; R, magnetostatic interaction parameter.
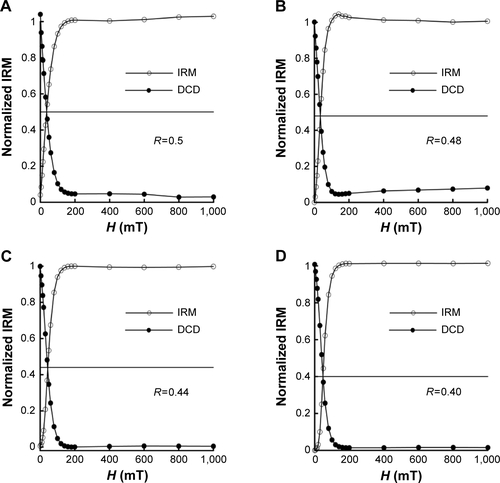
Figure S2 Low- and room-temperature magnetic analysis of M-HFn nanoparticles.
Notes: Hysteresis loops of M-HFn nanoparticles measured at (A) 300 K and (B) 5 K. (C) Low-field (1.5 mT) magnetization curves as a function of temperature measured after ZFC and FC treatments of the M-HFn nanoparticles.
Abbreviations: M-HFn, ferrimagnetic H-ferritin; ZFC, zero-field cooling; FC, field cooling; M, magnetization; H, magnetic field; Tb, blocking temperature.
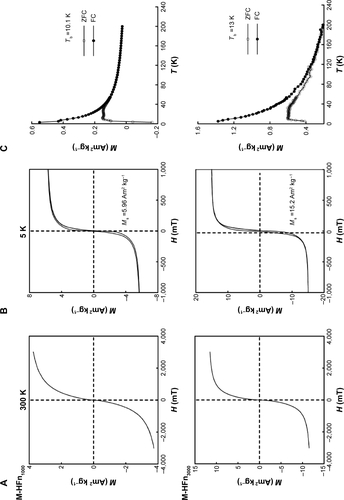
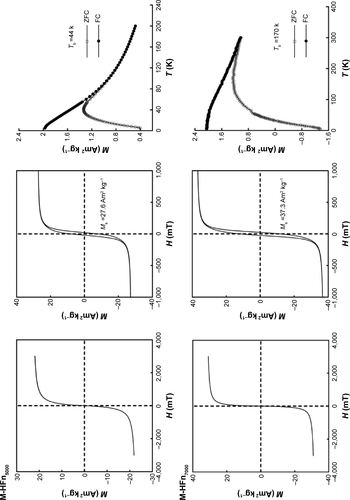
Figure S3 Analysis of transverse relaxivity of M-HFn nanoparticles by linear mapping iron concentration and 1/T2.
Notes: Transverse relaxivity (r2) analysis of (A) M-HFn1000, (B) M-HFn3000, (C) M-HFn5000, and (D) M-HFn7000. Slope of line represents r2.
Abbreviations: M-HFn, ferrimagnetic H-ferritin; T2, transverse relaxation times.
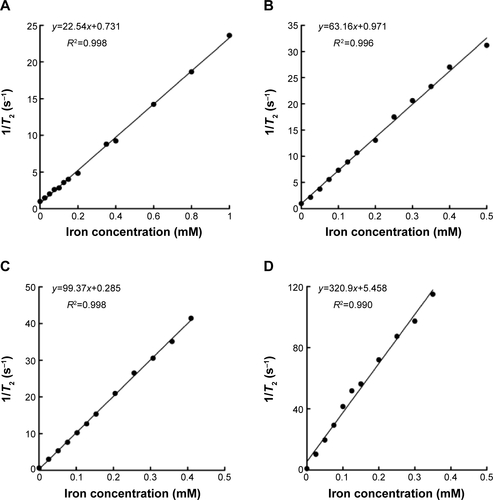
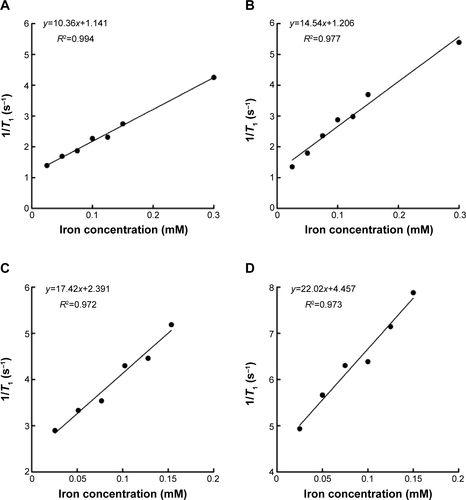
Figure S4 Analysis of longitudinal relaxivity of M-HFn nanoparticles by linear mapping iron concentration and 1/T1.
Notes: Longitudinal relaxivity (r1) analysis of (A) M-HFn1000, (B) M-HFn3000, (C) M-HFn5000, and (D) M-HFn7000. Slope of line represents r1.
Abbreviations: M-HFn, ferrimagnetic H-ferritin; T1, longitudinal relaxation times.