Figures & data
Figure 1 Macroscopic images of A) the TiO2 nanotube-fabricated TEST implant B) the blasted CONTROL implant. The thread pitch is 600 μm. C) Schematic of the experimental setup used for the electrochemical nanofabrication. D and E) One nanotube implant and one blasted implant were inserted in the femur condyle close to the knee joint of each rabbit.
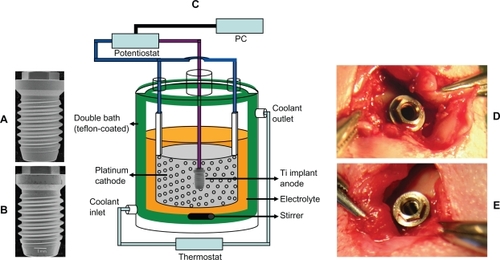
Figure 2 Characteristic current vs time curve showing the effects of A) the potential sweep mode and B) the potentiostatic mode performed on the blasted, screw-shaped implants using 100–150 μm particles of TiO2.
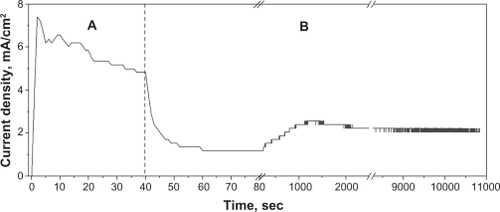
Figure 3 FE-SEM images of top view (first column), cross-section (second column), and bottom view (inset) of the nanotube implants formed in 1M H3PO4 + 0.4 wt.% HF at 20 V for A) 30 minutes, B) one hour, C) three hours (scale bar = 500 nm) and D) the blasted implants formed using 100–150 μm particles of TiO2 (scale bar = 5 μm).
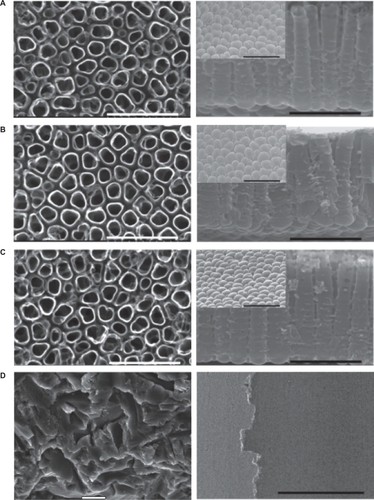
Figure 4 Variation of pore size, pore size distribution (PSD), and porosity with the reaction time used in nanotube formation of 30 minutes, one hour, and three hours.
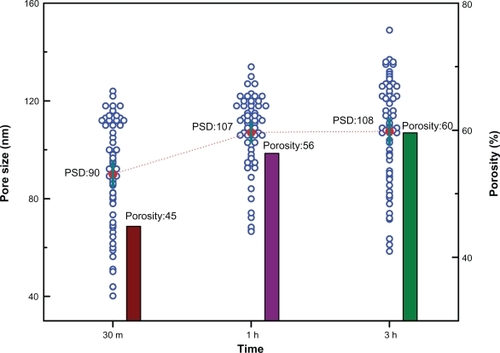
Table 1 Relative atom concentrations (at.%) of the implants identified by XPS measurements at the core-level energy regions of the target elements. () indicates atom concentration after the superficial contaminants (two monolayers) were removed using sputtering with Ar+ ions
Figure 5 High-resolution XPS spectra at A) the Ti 2p, B) O1s, and C) F 1s core-level energy region of the nanotube implants formed after A) 30 minutes, B) one hour, C) three hours, and d) the blasted implant. In order to extract the peak contributions at the F 1s energy region, spectral deconvolutions were performed using a numerical fitting procedure. Individual line shapes were simulated using a combination of the Lorentzian and Gaussian functions.
Abbreviation: XPS, X-ray photoelectron spectroscopy.
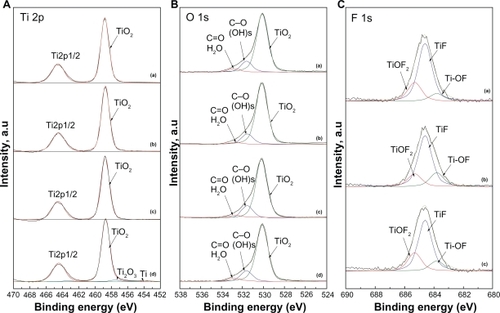
Figure 6 A) XRD spectra of the nanotube implants formed after A) 30 minutes, B) one hour, C) three hours, and D) the blasted implants. (B and C) The bar charts show how average roughness (Sa) decreases gradually and developed surface area (Sdr) increases slightly with reaction time.
Abbreviation: XRD, X-ray diffraction.
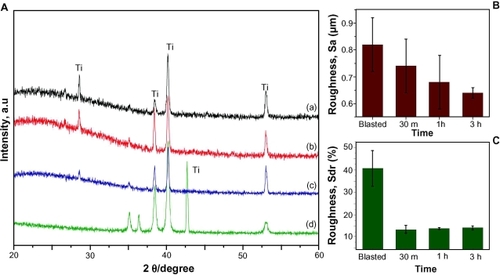
Figure 7 Three-dimensional images of TiO2 nanotubes electrochemically fabricated on blasted, screw-shaped titanium implants for A) 30 minutes, B) one hour, and C) three hours obtained using interferometry with a measuring volume of 230 × 230 × 5 μm3.
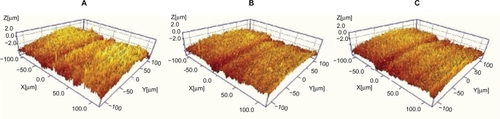
Figure 8 LM and BSE-SEM qualitative and quantitative observations of osseoconductivity on undecalcified cut and ground sections with the implants in bone. Basic fuchsin stained sections (A–E) show the following: well-developed trabecular architecture surrounding the implant placed in a rabbit femur A), pronounced new (immature woven) bone formation under the periosteum (dark pink staining) B), blood cells filling the space between the implant bottom and the new bone detached in the removal torque test C), newly formed bone (dark blue) inside the threads of the blasted implant D), and fluorinated TiO2 implants at the endosteal reagions E), clearly distinguished from the demarcation lines between dark and pale stained bone tissue. Toluidine-blue stained sections show variations in the nature of the direct bone contact between the blasted F) and fluorinated TiO2 implants G) (Scale bar = 500 μm). High-resolution BSE-SEM observations (3000×) show that the direct bone contact defined by LM observations turns out to be “real” direct bone/cell contact with the TiO2 nanotube implant surface more frequently than in the blasted implant (Scale bar = 5 μm).
Abbreviations: LM, light microscopy; BSE-SEM, back scattered electron scanning electron microscopy.
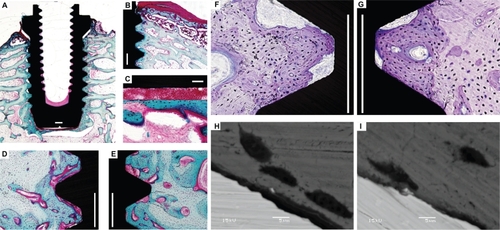
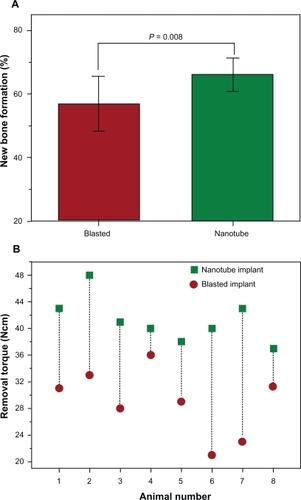
Figure 9 The fluorinated TiO2 nanotube implants in a rabbit femur for six weeks demonstrate superior bone responses over the blasted implants: A) new bone formation (57.5% vs 65.5%; P = 0.008) and (B) osseointegration strength (41 vs 29 Ncm; P = 0.008) (n = 8). Notably, every single nanotube implant showed a stronger osseointegration than the equivalent blasted implant paired in the same animal (B).