Figures & data
Figure 1 Bioconjugation scheme for cet-PEG-dexSPIONs.
Notes: (A) Surface modification of dextran-coated SPIONs with the dihydrazide-PEG linker (molecular weight, 5 kDa) via periodate oxidation of dextran. (B) Functionalization of cetuximab with active aldehyde functional groups via periodate oxidation. (C) Bioconjugation of cetuximab to PEG-dexSPIONs.
Abbreviations: cet, cetuximab; dex, dextran; PEG, polyethylene glycol; SPIONs, superparamagnetic iron oxide nanoparticles.
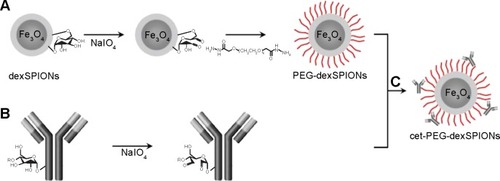
Figure 2 Confirmation of the bioconjugation of cetuximab to dexSPIONs by polyacrylamide gel and agarose gel electrophoresis analyses.
Notes: (A) Coomassie blue-stained 4%–12% Bis-Tris NuPAGE gel analysis revealed the successful cross-linking of cetuximab molecules on the surface of the iron oxide nanoparticles. Lane 1, periodate-treated cetuximab; lane 2, PEG-dexSPIONs; lane 3, the cetuximab-SPION conjugation mixture incubated at room temperature for 4 hours. The arrow indicates the Coomassie blue-stained cetuximab-SPION conjugates, which were trapped in the loading well of the polyacrylamide electrophoresis gel due to their larger particle size. (B) The iron oxide nanoparticles were visible as a brown band with a differing mobility shift in the agarose gel. The antibody molecules were visualized by Coomassie blue staining. The sample loading well is indicated by a dotted gray line. Lane 1, dexSPIONs; lane 2, PEG-dexSPIONs; lane 3, cet-PEG-dexSPIONs; lane 4, cetuximab.
Abbreviations: cet, cetuximab; dex, dextran; PEG, polyethylene glycol; SPIONs, superparamagnetic iron oxide nanoparticles.
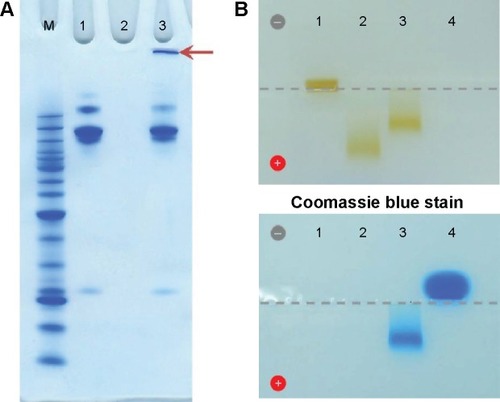
Table 1 Particle size and zeta potential of the synthesized iron oxide nanoparticles determined in double-distilled H2O using a Malvern-Zetasizer Nano instrument
Table 2 Longitudinal and transversal relaxivities (r1 and r2) of dexSPIONs and the synthesized nanoprobes at 20 mHz at 37°C (Minispec)
Figure 3 EGFRvIII-ECD-hFc binding determined by enzyme-linked immunosorbent assay.
Notes: Soluble EGFRvIII-ECD-hFc was coated on enzyme-linked immunosorbent assay plates, and binding of cetuximab (A) or cetuximab-functionalized and non-functionalized iron oxide nanoparticles (B) was detected using a horseradish peroxidase-conjugated goat anti-human kappa light chain antibody. The concentrations tested ranged from 1.34×10⁻⁴ to 10 μg/mL for the anti-EGFR monoclonal antibody cetuximab and from 6.4×10⁻⁴ to 120 μg Fe/mL for cet-PEG-dexSPIONs and PEG-dexSPIONs. The EC50 was 0.0242 and 0.0646 μg/mL for cetuximab and cet-PEG-dexSPIONs, respectively. Each point represents the mean ± standard deviation of three determinations.
Abbreviations: cet, cetuximab; dex, dextran; ECD, extracellular domain; EGFR, epithelial growth factor receptor; OD, optical density; PEG, polyethylene glycol; SPIONs, superparamagnetic iron oxide nanoparticles.
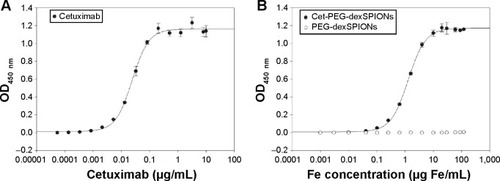
Figure 4 Binding specificity of cetuximab, PEG-dexSPIONs, and cet-PEG-dexSPIONs.
Notes: (A) For immunostaining of A431 cells, the cells were incubated with the indicated antibody or particles on ice for one hour. Dylight 488-conjugated anti-human Fcγ antibody was used as the detection antibody for fluorescence imaging. The nuclei of the cells were counterstained with DAPI (blue color). Bright field and merged cell images of Dylight 488/DAPI are shown in the upper and bottom rows, respectively. Images were obtained with a 40× objective lens. (B, C) Flow cytometry analysis of antibodies or nanoparticles specific to A431 cells. A431 cells were incubated with human IgG (negative control), cetuximab (positive control), or the synthesized magnetic probes at the indicated concentrations on ice for one hour. The cells were then stained on ice in the dark with R-PE-conjugated mouse anti-human IgG mAb (B) and fluorescein isothiocyanate-conjugated mouse anti-dextran mAb (C) for one hour to detect the human IgG molecules and dextran-coated magnetic nanoparticles, respectively, on the surface of A431 cells. (D) Competition assay by flow cytometry. The competition assay was performed as described in (C) except that A431 cells were treated on ice for one hour with 10 or 20 μg/mL cetuximab prior to treatment with the iron oxide nanoparticles. (E) Flow cytometry results showing that cet-PEG-dexSPIONs specifically targeted A431 that was spiked into PBMCs (105 A431 cells were spiked into 106 PBMCs). Fc receptors on the surface of PBMCs were blocked with FcR blocking reagents at 4°C for 20 minutes, and the cells were then incubated with cetuximab (positive control) or the synthesized magnetic probes at the indicated concentrations on ice for one hour. The cells were then immediately stained on ice in the dark with fluorescein isothiocyanate-conjugated goat anti-mouse IgG secondary antibody for an additional 30 minutes to detect cetuximab molecule binding to the surface of A431 cells. The arrow indicates the signal for unstained A431 cells.
Abbreviations: cet, cetuximab; DAPI, 4′,6-diamidino-2-phenylindole; dex, dextran; Ig, immunoglobulin; PEG, polyethylene glycol; SPIONs, superparamagnetic iron oxide nanoparticles; PBMCs, peripheral blood mononuclear cells; PE, phycoerythrin; mAb, monoclonal antibody.
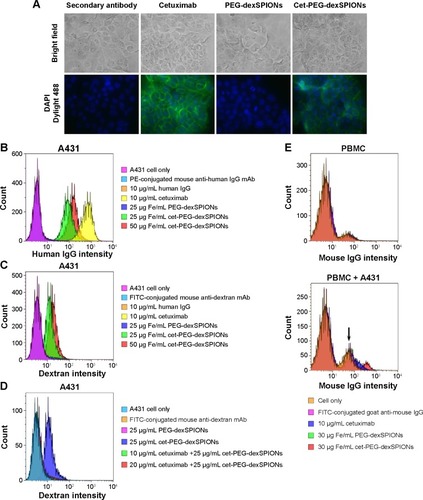
Table 3 Iron content of differential EGFR-expressing cells after a 2-hour incubation at 37°C with the synthesized iron oxide nanoparticles
Figure 5 Iron uptake among the cell lines with differential EGFR expression levels. The A431, 32D, and 32D/EGFR cell lines were incubated with 25 μg Fe/mL of PEG-dexSPIONs or cet-PEG-dexSPIONs at 37°C for 2 hours. The excess iron was removed by washing with 1× phosphate-buffered saline, and the iron concentration in 4×10⁶ cells from each cell line was determined using a thiocyanate-based spectrophotometric assay. The results are presented as the mean ± standard deviation of four determinations.
Abbreviations: cet, cetuximab; dex, dextran; EGFR, epidermal growth factor receptor; PEG, polyethylene glycol; SPIONs, superparamagnetic iron oxide nanoparticles.
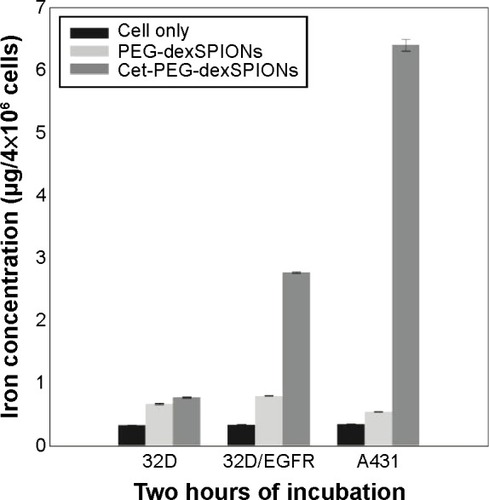
Figure 6 Therapeutic effect of cet-PEG-SPIONs.
Notes: (A) Inhibition of epidermal growth factor-induced tyrosine phosphorylation of EGFR by cet-PEG-dexSPIONs. A431 cells were serum-starved overnight and then treated with cetuximab, cet-PEG-dexSPIONs, or PEG-dexSPIONs at varying doses for 2 hours at 37°C. A431 cells were further stimulated with 30 ng/mL EGF for 30 minutes at 37°C. Cell lysates were separated by electrophoresis, and immunoblotting was performed to detect the p-EGFR (Tyr1173) and total EGFR levels. β-actin was used as a loading control. A representative of three blots is shown. (B) EGFR internalization in response to cet-PEG-dexSPIONs treatment in A431 cells. Cells were incubated for the indicated times in the presence of cetuximab (2.5 μg/mL), cet-PEG-dexSPIONs (50 μg Fe/mL), or PEG-dexSPIONs (50 μg Fe/mL). After stripping off the surface-bound cetuximab or nanoparticles, the cells were stained on ice for one hour with PE-conjugated mouse anti-human EGFR monoclonal antibody to determine the EGFR level remaining on the cell surface by flow cytometry. The expression level of EGFR on untreated A431 cells at 0 hours was set at 100%. (C) Apoptosis-inducing activity of cet-PEG-dexSPIONs in EGFR-expressing cell lines analyzed by an Annexin V-fluorescein isothiocyanate/propidium iodide assay. The stacked bar graph shows the proportion of different cell populations among the EGFR-null 32D cells, EGFR-overexpressing 32D/EGFR cells, and A431 cells.
Abbreviations: cet, cetuximab; dex, dextran; EGF, epidermal growth factor; PEG, polyethylene glycol; PE, phycoerythrin; SPIONs, superparamagnetic iron oxide nanoparticles; p-EGFR, phosphorylated epidermal growth factor receptor.
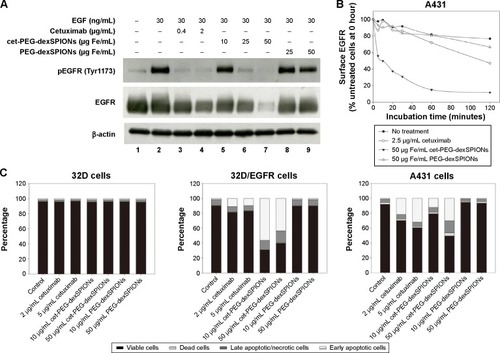
Figure 7 T2-weighted image of A431 and 32D cells at different doses of the synthesized SPIONs. A431 and 32D cells were incubated at 37°C for 2 hours with PEG-dexSPIONs or cet-PEG-dexSPIONs at iron concentrations of 10, 20, 40, 80, and 160 μg/mL. Tumor cells treated with fresh culture medium alone served as a control. The excess iron was removed by washing with 1× PBS, and the cells were suspended in a 1% agarose gel for the following in vitro MRI analysis using a 4.7 T scanner. The agarose gel containing PBS alone without any cells was used as a blank. The plot of the MRI signal intensity as a function of the iron concentration of the synthesized SPIONs revealed the MRI capability of the synthesized magnetic nanoparticles.
Abbreviations: cet, cetuximab; dex, dextran; MRI, magnetic resonance imaging; PEG, polyethylene glycol; PBS, phosphate-buffered saline; SPIONs, superparamagnetic iron oxide nanoparticles; a.u., arbitrary units.
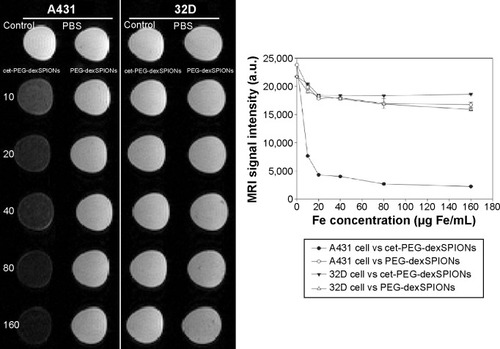
Figure S1 Quantitation of immobilized cetuximab using the micro bicinchoninic acid protein assay. Cetuximab solution supplemented with an amount of iron equal to that in the synthesized cet-PEG-dexSPION sample, ranging from 0 to 12 μg/mL, was used as a standard curve. The values for the OD at 562 nm were plotted against the concentration of cetuximab. The results are presented as the mean ± standard deviation of three determinations.
Abbreviations: cet, cetuximab; dex, dextran; PEG, polyethylene glycol; SPIONs, superparamagnetic iron oxide nanoparticles; OD, optical density.
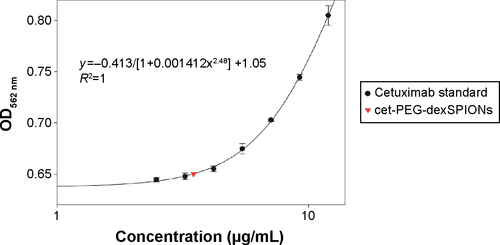
Figure S2 Transmission electron micrographs of dexSPIONs, PEG-dexSPIONs, and cet-PEG-dexSPIONs. The average size of particles estimated from the transmission electron images was about 10–20 nm. Scale bar, 50 nm.
Abbreviations: cet, cetuximab; dex, dextran; PEG, polyethylene glycol; SPIONs, superparamagnetic iron oxide nanoparticles.
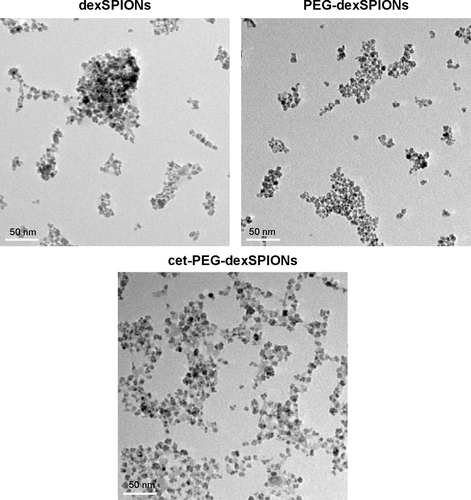
Figure S3 Characterization of the synthesized SPIONs.
Notes: (A) Hydrodynamic diameter of iron oxide nanoparticles determined by dynamic light scattering analysis. (B) Relaxivity values for the dexSPIONs and the synthesized nanoprobes. The longitudinal relaxation time (T1) and transverse relaxation time (T2) were measured at 37°C using a Bruker Minispec mq20 nuclear magnetic resonance analyzer (20 mHz) at iron concentrations of 0.1 to 0.5 mM for dexSPIONs, PEG-dexSPIONs, and cet-PEG-dexSPIONs, as measured immediately after vortexing in water solution. The longitudinal (r1) and transverse (r2) relaxivities of the iron oxide particles were determined based on the slopes of the linear regression of the longitudinal relaxation rate R1 (1/T1) or transverse relaxation rate R2 (1/T2) versus the iron concentration. The estimated relaxivity values for dexSPIONs were r1 =22.575 mM−1⋅s−1 (correlation coefficient of 0.9866), r2=162.8 mM−1⋅s−1 (correlation coefficient of 0.9972); for PEG-dexSPIONs, r1=29.18 mM−1⋅s−1 (correlation coefficient of 0.9999), r2=252.25 mM−1⋅s−1 (correlation coefficient of 0.9998); for cet-PEG-dexSPIONs, r1=10.586 mM−1⋅s−1 (correlation coefficient of 0.9808), r2=110.08 mM−1⋅s−1 (correlation coefficient of 0.9951).
Abbreviations: cet, cetuximab; dex, dextran; PEG, polyethylene glycol; SPIONs, superparamagnetic iron oxide nanoparticles.
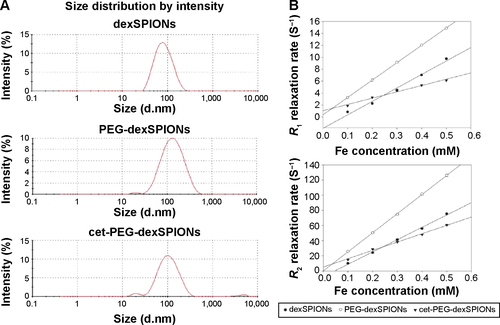
Figure S4 In vitro cytotoxicity of PEG-dexSPIONs and cet-PEG-dexSPIONs to the Hs68 cell line. The Hs68 cells were incubated with PEG-dexSPIONs or cet-PEG-dexSPIONs at iron concentrations ranging from 25 to 100 μg Fe/mL for 8 and 24 hours. Cytotoxicity was assessed by the Alamar Blue cytotoxicity assay. Results are presented as the mean ± standard deviation of four replicates.
Abbreviations: cet, cetuximab; dex, dextran; PEG, polyethylene glycol; SPIONs, superparamagnetic iron oxide nanoparticles.
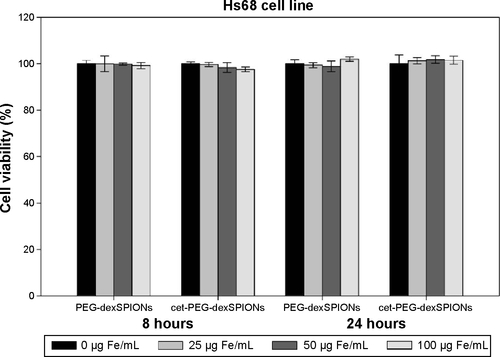
Figure S5 EGFR expression levels on the surface of tumor cell lines. EGFR expression on the surface of tumor cell lines was examined by flow cytometry using PE-conjugated mouse anti-human EGFR mAb. A PE-conjugated mouse IgG2b κ isotype served as a negative control. The cell surface expression levels of EGFR were A431 > 32D/EGFR. In contrast, 32D cells were devoid of EGFR.
Abbreviations: cet, cetuximab; dex, dextran; EGFR, epidermal growth factor receptor; PEG, polyethylene glycol; SPIONs, superparamagnetic iron oxide nanoparticles; PE, phycoerythrin; mAb, monoclonal antibody; Ig, immunoglobulin.
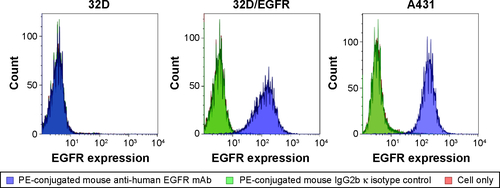
Figure S6 Apoptosis-inducing activity of cet-PEG-dexSPIONs in differential EGFR-expressing cell lines analyzed by an Annexin V-FITC/propidium iodide assay.
Notes: 32D (A), 32D/EGFR (B) and A431 (C) cells (1×10⁵ cells) were incubated in 0.5 mL of complete medium containing cetuximab (2 or 5 μg/mL) or iron oxide nanoparticles (25 or 50 μg Fe/mL). Tumor cell lines with different levels of EGFR expression (1×10⁵ cells) were incubated in 0.5 mL of complete medium containing cetuximab (2 or 5 μg/mL) or iron oxide nanoparticles (25 or 50 μg Fe/mL). After incubation for 24 hours, these cells were harvested and double-stained with FITC-conjugated Annexin-V and propidium iodide. The cell populations as a percent of the total cells were assessed by flow cytometry. The arrow indicates a significant increase in the cell population after the cells were treated with cet-PEG-dexSPIONs at the indicated concentrations. Annexin V-FITC-negative/propidium iodide-negative, viable cells; Annexin V-FITC-positive/propidium iodide-negative, early apoptotic cells; Annexin V-FITC-negative/propidium iodide-positive, dead cells; Annexin V-FITC-positive/propidium iodide-positive, late apoptotic cells and necrotic cells.
Abbreviations: cet, cetuximab; dex, dextran; EGFR, epidermal growth factor receptor; FITC, fluorescein isothiocyanate; PEG, polyethylene glycol; SPIONs, superparamagnetic iron oxide nanoparticles.
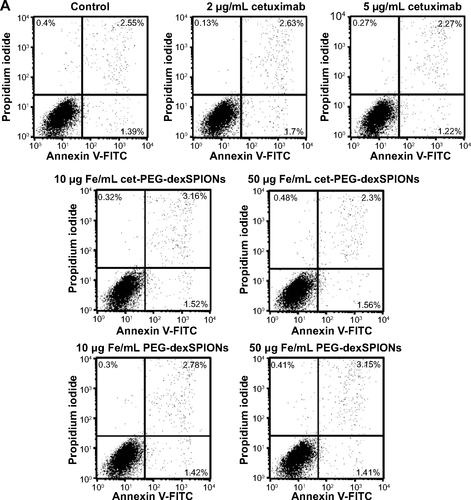
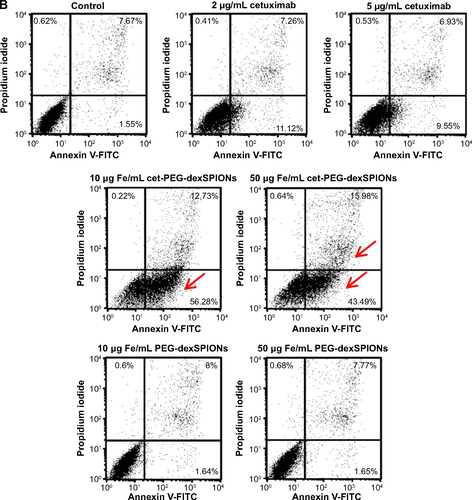
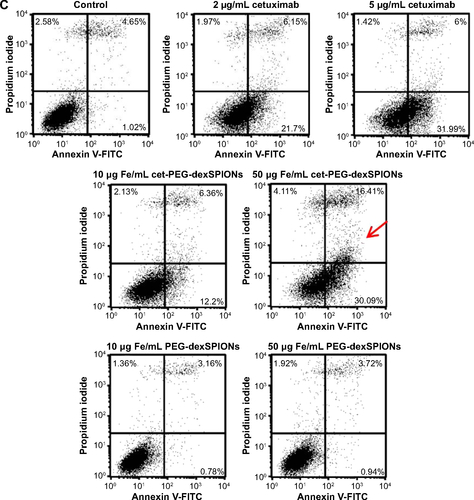
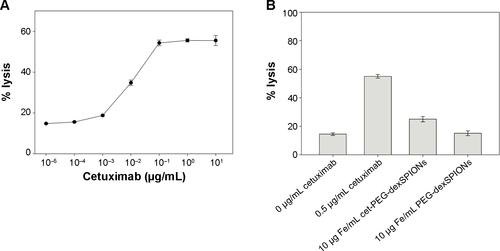
Figure S7 ADCC activity against A431 cells mediated by cetuximab.
Notes: (A) Concentration-dependent curve of cetuximab-mediated ADCC activity against A431 cells by NK-92-hCD16V-GFP cells. A431 cells were incubated with NK-92-hCD16V-GFP cells at an E:T ratio of 10 to 1 along with indicated concentrations of cetuximab (0.00001–10 μg/mL). The ADCC activity was determined based on the 4-hour lactate dehydrogenase release into the supernatant by A431 cells. The results are presented as the percent cell lysis in the antibody-treated groups compared with 100% lysis in the 1% Triton X-100 lysis buffer-treated group. (B) ADCC activity of cet-PEG-dexSPIONs against A431 cells by NK-92-hCD16V-GFP cells. A431 cells were incubated in the absence or presence of 10 μg Fe/mL synthesized iron oxide nanoparticles. Cetuximab 0.5 μg/mL served as a positive control. The data are representative of three independent experiments and are presented as the mean ± standard deviation of four determinations.
Abbreviations: ADCC, antibody-dependent cell-mediated cytotoxicity; cet, cetuximab; dex, dextran; PEG, polyethylene glycol; SPIONs, superparamagnetic iron oxide nanoparticles.