Figures & data
Figure 1 Schematic diagram of the SEDS process.
Abbreviation: SEDS, solution-enhanced dispersion by supercritical carbon dioxide (CO2); P, pressure; T, temperature; HPLC, high performance liquid chromatography.
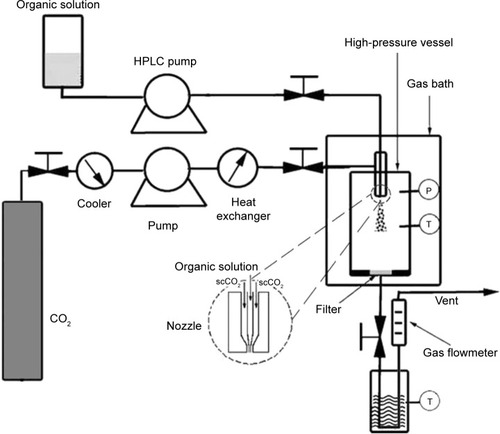
Table 1 Experimental factors and levels
Table 2 Experimental design and results of full factorial design
Figure 2 SEM micrograph of the original curcumin powders.
Abbreviation: SEM, scanning electron microscopy.
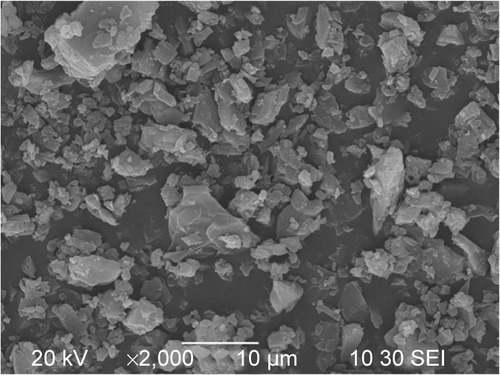
Figure 3 SEM micrographs of curcumin nanoparticles prepared by the SEDS process under different conditions (A) 0.5%-35°C-0.5 mL/min-20 Mpa; (B) 0.5%-45°C-1 mL/min-10 Mpa; (C) 0.5%-45°C-0.5 mL/min-10 Mpa; (D) 5%-45°C-0.5 mL/min-20 Mpa; (E) 0.5%-35°C-1 mL/min-10 Mpa; (F) 1%-45°C-0.5 mL/min-20 Mpa; (G) 1%-45°C-1 mL/min-20 Mpa; (H) 1%-35°C-1 mL/min-20 Mpa; (I) 0.5%-35°C-1 mL/min-20 Mpa.
Abbreviations: SEM, scanning electron microscopy; SEDS, solution-enhanced dispersion by supercritical carbon dioxide (CO2).
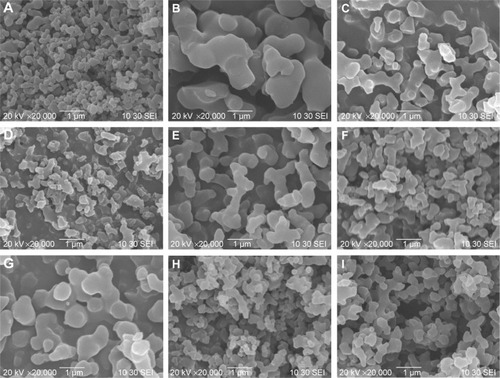
Table 3 Estimated effects and coefficients for particle size (nm) (coded units)
Figure 4 Standardized effect of the factors on particle size.
Figure 5 Main effects plot for particle size.
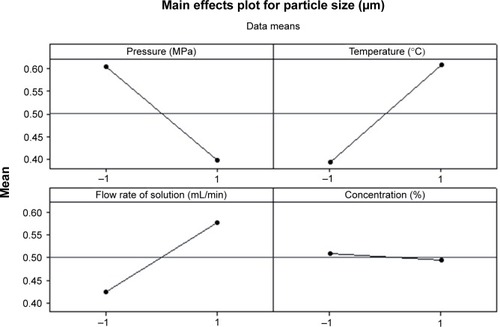
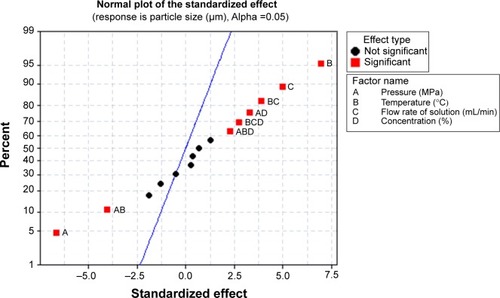
Figure 5 Main effects plot for particle size.
Figure 6 FTIR spectra of original curcumin and curcumin nanoparticles prepared by the SEDS process under optimal conditions.
Abbreviations: FTIR, Fourier transform infrared; SEDS, solution-enhanced dispersion by supercritical carbon dioxide (CO2).
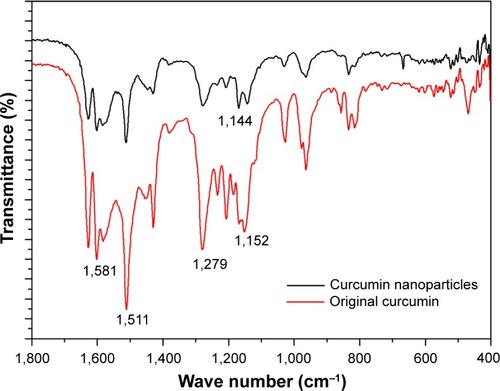
Figure 7 XRPD pattern of original curcumin and curcumin nanoparticles prepared by the SEDS process under optimal conditions. inset is a partially enlarged view.
Abbreviations: XRPD, X-ray powder diffraction; SEDS, solution-enhanced dispersion by supercritical carbon dioxide (CO2).
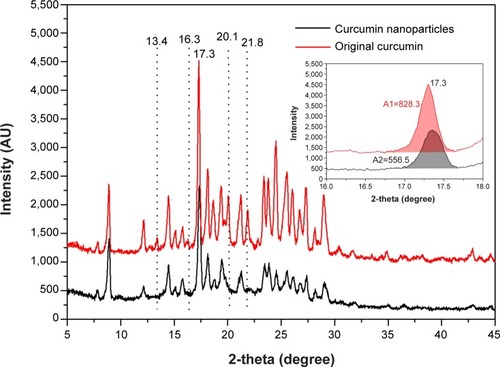
Figure 8 DSC curves of original curcumin and curcumin nanoparticles prepared by the SEDS process under optimal conditions.
Abbreviations: DSC, differential scanning calorimetry; SEDS, solution-enhanced dispersion by supercritical carbon dioxide (CO2).
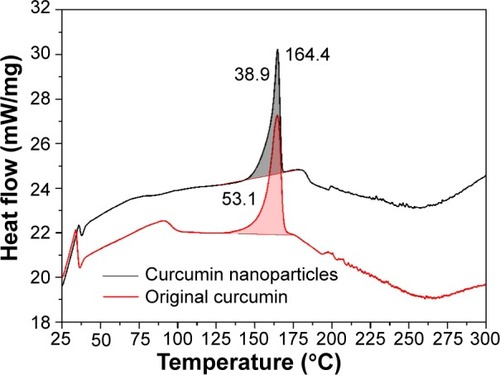
Figure 9 TG curves of original curcumin and curcumin nanoparticles prepared by the SEDS process under optimal conditions.
Abbreviations: TG, thermogravimetric; SEDS, solution-enhanced dispersion by supercritical carbon dioxide (CO2).
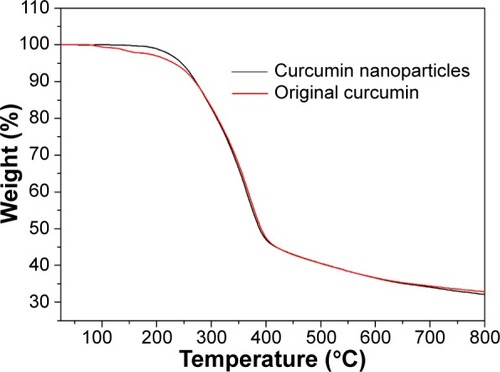
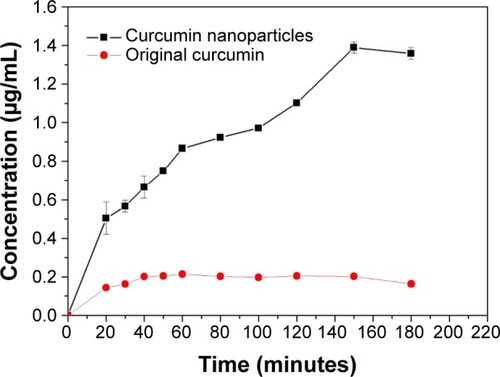
Figure 10 Dissolution profiles of original curcumin and curcumin nanoparticles prepared by the SEDS process under optimal conditions.
Abbreviation: SEDS, solution-enhanced dispersion by supercritical carbon dioxide (CO2).