Figures & data
Figure 1 Schematic diagram of self-assembly of Gd-DTPA/DACHPt-loaded micelles.
Notes: MRI-detectable polymeric micelles for simultaneous diagnosis and therapy are created by incorporating the T1-weighted MRI contrast agent Gd-DTPA and the platinum anticancer drug DACHPt nitrate chloride, which is the parent complex of the anticancer drug oxaliplatin, within the micelle cores.

Figure 2 Transmission electron microscopy image of Gd-DTPA/DACHPt-loaded micelles, the Gd-DTPA/DACHPt-loaded micelles come out as white spots.
Abbreviations: DACHPt, (1,2-diaminocyclohexane)platinum(II); Gd-DTPA, gadolinium-diethylenetriaminpentaacetic acid.
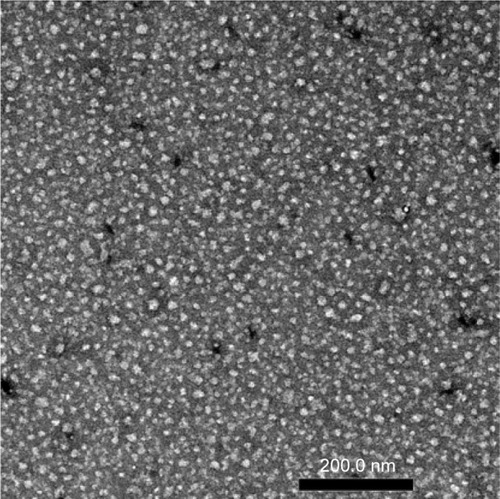
Figure 3 MRI performance of Gd-DTPA/DACHPt-loaded micelles in an N1-S1 hepatic tumor (yellow arrow).
Notes: (A) T1-GE MRI series after the injection of Gd-DTPA/DACHPt-loaded micelles. The MR images collected at 2 minutes and every 10 minutes after the injection showed that the tumor contrast enhancement remained stable for up to 3 hours. (B) The signal intensity of the tumor increased considerably to a level greater than that of the surrounding liver, whereas the signal intensity of the healthy liver remained near the initial values. (C, E) T1-GE MRI series after the injection of free Gd-DTPA or DACHPt micelles, any enhancement of the contrast was not observed in the tumor. (D, F) The tumor intensities remained lower than that of the healthy liver with both control treatments. A tube containing H2O was set at the upper right as a reference (white arrows).
Abbreviations: DACHPt, (1,2-diaminocyclohexane)platinum(II); Gd-DTPA, gadolinium-diethylenetriaminpentaacetic acid; T1-GE MRI, T1-weighted gradient echo magnetic resonance imaging.

Figure 4 Images showing the tumors, histopathology, and tumor apoptosis.
Notes: (A) Macroscopic image of a tumor. (B, C) Microscopic characterization of an N1-S1 hepatic tumor. Malignant cells with hyperchromatic nuclei, a high nuclear/cytoplasmic ratio, and poor differentiation, along with hypervascularization and scattered necrotic regions. (D, E) Microscopic analysis of H&E-stained tumor sections reveals two different regions: one containing typical malignant cells and the other containing disrupted cells characterized by missing nuclei, indistinct cell walls, or nuclei without surrounding cell structures. Upon collation with the observations from the fluorescent TUNEL assay, these disrupted cell regions were found to correspond with the regions with high levels of positive fluorescein-12-dUTP incorporation (TUNEL-positive regions).
Abbreviations: DAPI, 4′,6-diamidino-2-phenylindole; H&E, hematoxylin and eosin; TUNEL, terminal deoxynucleotidyl transferase dUTP nick-end labeling.
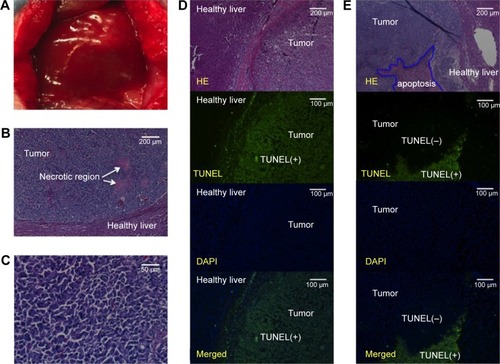
Figure 5 Apoptotic area percentages among the tumors at 3 days postinjection were 92.4%±3.4% with the micelles (n=10), 45.3%±20.8% with oxaliplatin (n=10), and 9.65%±5.9% with saline (n=10).
Notes: Gd DTPA/DACHPt-loaded micelles induced significant tumor cell death much more efficiently than free oxaliplatin and saline (*P<0.001).
Abbreviations: DACHPt, (1,2-diaminocyclohexane)platinum(II); Gd-DTPA, gadolinium-diethylenetriaminpentaacetic acid.
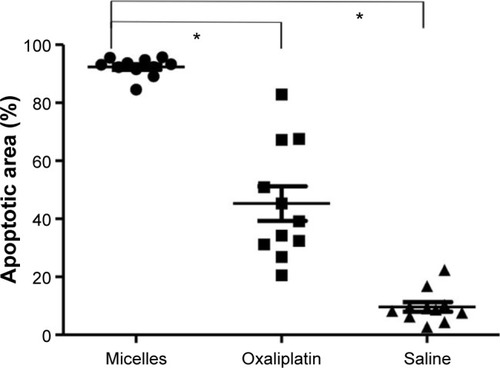
Figure 6 Tumor volume after the injection of micelles, oxaliplatin, or saline.
Notes: At 3 days postinjection, the mean tumor volume of the micelle group decreased to 171 mm3 (74.0% of the preinjection volume), and this tumor suppression continued until 10 days postinjection. The mean tumor volumes at day 14 were significantly larger in the oxaliplatin or saline injected rats than in the micelles injected rats (*P<0.05). Values are shown as mean ± SD.
Abbreviation: SD, standard deviation.
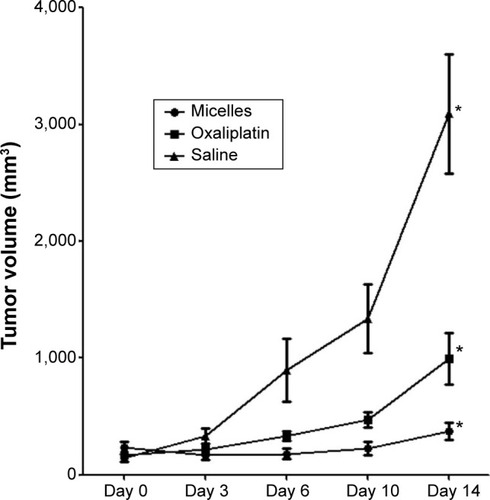
Figure 7 Survival outcomes after treatment.
Notes: The median survival duration after micelle injection (28 days) was significantly longer than those after oxaliplatin injection (20 days; P*<0.05) and saline injection (18 days; P*<0.05). Median values are shown with horizontal bars.
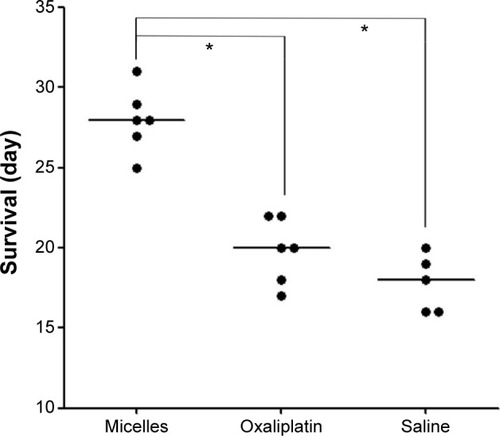
Figure 8 Body weight alternation following the injection of Gd-DTPA/DACHPt-loaded micelles, oxaliplatin, and saline.
Notes: The injection of oxaliplatin caused the most severe weight loss among groups.
Abbreviations: DACHPt, (1,2-diaminocyclohexane)platinum(II); Gd-DTPA, gadolinium-diethylenetriaminpentaacetic acid.
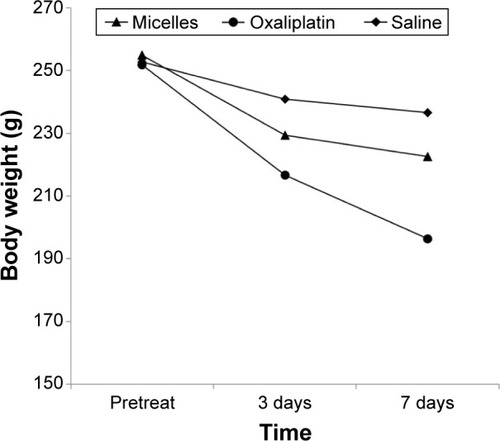
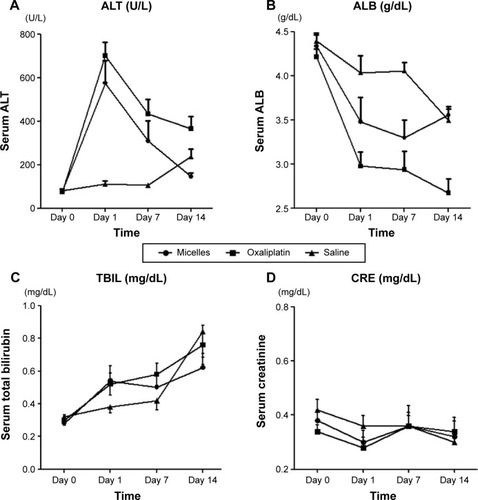
Figure 9 Blood test results.
Notes: (A) Alanine aminotransferase levels were increased after injection with both the micelles and oxaliplatin; however, more severe increases in alanine aminotransferase levels were observed after injection with oxaliplatin. (B) In the micelle-treated rats, blood albumin levels were decreased on days 1 and 7 and increased on day 14. In contrast, in the oxaliplatin-treated rats, blood albumin levels were markedly decreased until day 14. (C) Total bilirubin levels were not affected by either treatment. (D) Creatinine levels did not increase in all three groups.
Abbreviations: ALB, albumin; ALT, alanine aminotransferase; CRE, creatinine; TBIL, total bilirubin.