Figures & data
Table 1 The steps of three immunohistochemical methods for Toll-like receptor 4 (TLR4) detection
Figure 1 Agarose gel (1%) electrophoresis of (A) quantum dot (QD)–anti-aldose reductase (AR) conjugates and (B) QD–anti-Toll-like receptor 4 (TLR4) conjugates. (Aa and Ba) Fluorescent of CdSe/CdS/ZnS quantum dots with the emission wavelength of 620 nm (QDs-620) in the gels imaged under ultraviolet illumination. (Ab and Bb) Protein bands in the gels stained by Coomassie Brilliant Blue.
Notes: Line 1 in each image are QDs-620 alone. Lines 2–6 are conjugates of different QD:primary antibody ratios from 5:1 to 5:5. Line 7 in each image is the (Aa and b) AR antibody or (Ba and b) TLR4 antibody alone.
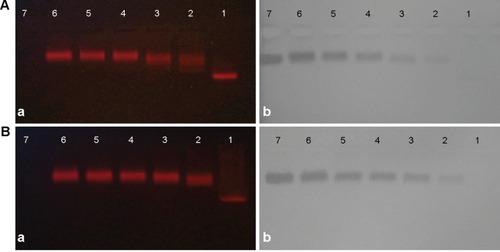
Figure 2 The expression of aldose reductase in COS-7 cells transfected with (A) the plasmid of pHAR and (B) empty vector by immunohistochemistry. (C) The expression of EGFP in COS-7 cells transfected with the plasmid of pHAG.
Note: Scale bar: 50 μm.
Abbreviation: EGFP, the green fluorescent protein gene.
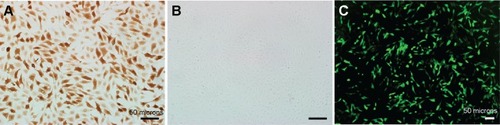
Figure 3 Quantum dot (QD)-based immunofluorescence of aldose reductase (AR) in COS-7 cells transfected with (A and B) plasmid pHAR and (C) empty vector. The cells in (A) were stained by quantum dots with the emission wavelength of 605 nm conjugated to streptavidin (QDs-605–SA) and the cells in (B) were stained by CdSe/CdS/ZnS quantum dots with the emission wavelength of 620 nm (QDs-620)–anti-AR conjugates. Cells in (C) were blank control. The column on the left displays AR images labeled by QDs, and the middle column shows the nucleus images. The column on the right shows the overlays of QD fluorescence and nucleus images. (D) QD emission spectra data used for unmixed image.
Note: Scale bars: 50 μm.
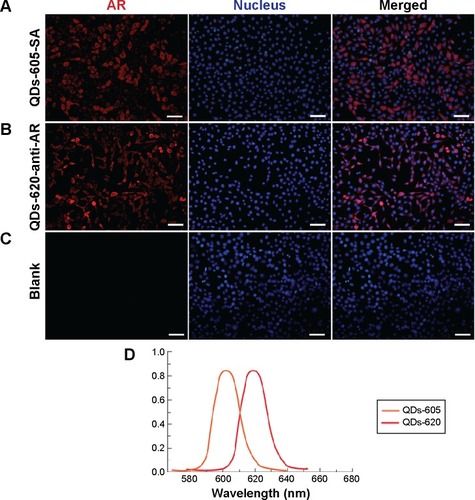
Figure 4 Hematoxylin and eosin staining of the renal cortex of (A) normal rats and (B) diabetic rats. The red arrow indicates the glomerulus and the black arrow indicates the tubule.
Note: Scale bars: 100 μm.
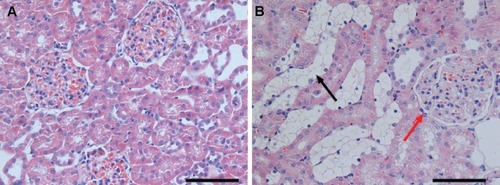
Figure 5 Distribution of Toll-like receptor 4 (TLR4) protein in the renal tissues of (A–C) normal rats and (D–F) diabetic rats identified with immunohistochemistry (IHC) and quantum dot (QD)-IHC. The column on the left displays 3,3′-diaminobenzidine (DAB) staining, the middle column shows TLR4 stained by quantum dots with the emission wavelength of 605 nm conjugated to streptavidin (QDs-605–SA), and the column on the right shows TLR4 stained by CdSe/CdS/ZnS quantum dots with the emission wavelength of 620 nm (QDs-620)–anti-TLR4 conjugates. TLR4 protein localization patterns were the same when detected by the three staining methods. The middle and right columns were excited by blue light. The green background in (B, C, E, and F) is tissue autofluorescence (yellow arrows) and the red signal is QD fluorescence (red arrows).
Note: Scale bars: 100 μm.
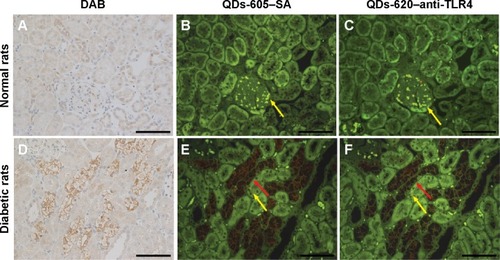
Figure 6 The expression of aldose reductase (AR) stained by 3,3′-diaminobenzidine (DAB) and quantum dots with the emission wavelength of 605 nm conjugated to streptavidin (QDs-605-SA) in rat renal tissues. (A, B, E, and F) Normal rat tissue; (C, D, G, and H) diabetic rat tissue. The green background in (E–H) is tissue autofluorescence and the red signal is quantum-dot fluorescent. The expression of AR is located in the glomerulus (yellow arrows) and renal interstitium (red arrows) of rats.
Note: Scale bars: 100 μm.
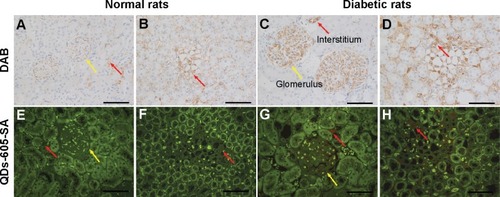
Table 2 The overall characteristics of three immunohistochemical methods
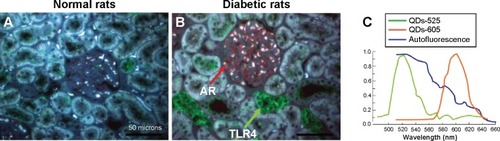
Figure 7 Multiplexed quantum-dot (QD) imaging of aldose reductase (AR) and Toll-like receptor 4 (TLR4) expressed in the kidneys of diabetic rats. AR (red arrow) and TLR4 (green arrow) were simultaneously labeled with the nano-probes – quantum dots with the emission wavelength of 605 nm (QDs-605) and quantum dots with the emission wavelength of 525 nm (QDs-525), respectively. (A) Normal rat renal tissue. (B) Diabetic rat renal tissue. The tissues were excited by ultraviolet light (the blue colors are the autofluorescence of tissues). (C) QD emission spectrum.
Note: Scale bars: 100 μm.