Figures & data
Figure 1 Chemical structure of tanshinone IIA.
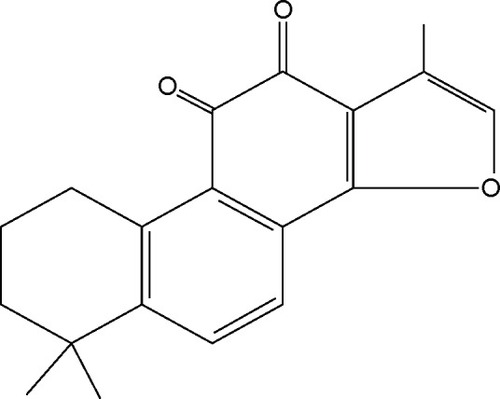
Table 1 Grading of adhesions in rats according to the criteria of Nair et alCitation27
Figure 2 Illustration of experimental postoperative peritoneal adhesions in rats.
Notes: (A) Creation of ischemic buttons to peritoneal sidewall. (B) Adhesions to the buttons at postoperative day 7.
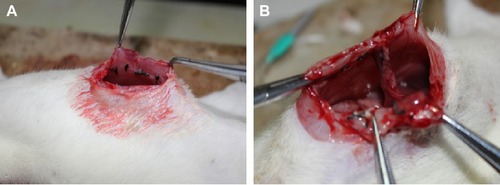
Table 2 Particle sizes, zeta potentials, and polydispersity index values of various NPs (n=3)
Figure 3 Characterization of Tan IIA-NPs and blank NPs.
Notes: Transmission electron microscopy images of (A) blank NPs ×25.0 k and (B) Tan IIA-NPs ×25.0 k. Malvern Zetasizer 3000 HSA size measurement of (C) blank NPs and (D) Tan IIA-NPs. Malvern Zetasizer 3000 HSA zeta potential measurement of (E) blank NPs and (F) Tan IIA-NPs.
Abbreviations: NPs, nanoparticles; Tan IIA-NPs, tanshinone IIA liquid NPs.
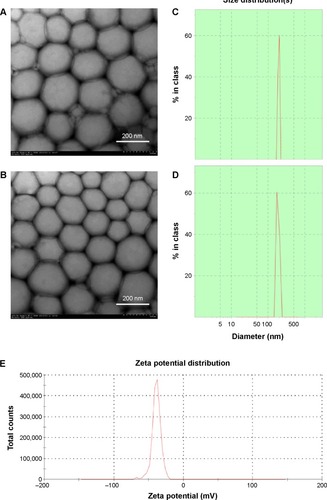
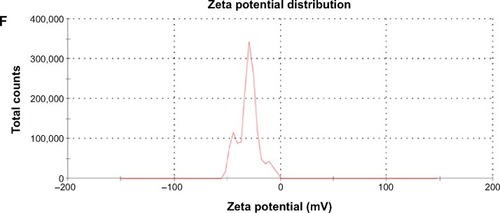
Table 3 Characterization of Tan IIA-NPs stored under 60°C and room temperature with 4,500±500 lx for 10 days (n=3)
Table 4 Characterization of Tan IIA-NPs stored at 25°C±2°C away from light during 12 months (n=3)
Table 5 The content of bacterial endotoxin in each batch (n=10)
Table 6 Effects on hematology, liver function, and kidney function parameters in healthy BALB/c mice determined by acute toxicity study (n=20)
Figure 4 The change of body weight (g) of mice before and after administration of corresponding solutions over 14 days.
Notes: Body weight (g) of mice in each group slowly increased during the 2-week period. There was no significant difference in body weight compared with the saline group.
Abbreviations: NPs, nanoparticles; Tan IIA-NPs, tanshinone IIA liquid NPs.
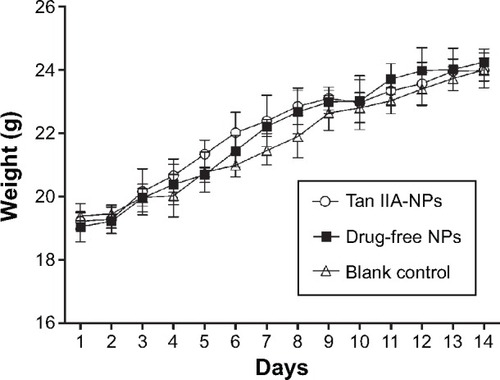
Figure 5 Histological staining of excised organs from healthy BALB/c mice following intravenous administration three times within 24 hours with (A) 0.9 g/dL natrium chloride, (B) drug-free NPs, or (C) Tan IIA-NPs.
Note: Representative images of organ sections were at 400× magnification.
Abbreviations: NPs, nanoparticles; Tan IIA-NPs, tanshinone IIA liquid NPs.
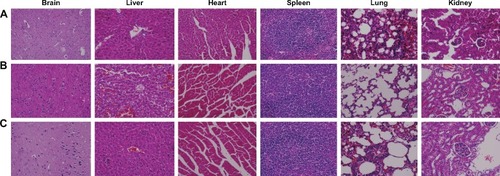
Table 7 Intra-abdominal adhesion scores of groups (n=15)
Figure 6 Effects of tPA activity in intraperitoneal lavage fluid.
Notes: High, medium and low dose groups were administered with 10, 5 and 2.5 mg/kg Tan IIA-NPs via tail vein injection, respectively. High- (n=15), medium(n=15), and low-dose (n=15) groups showed a significant increase in tPA activity in peritoneal fluid compared with the control, blank, and drug-free NP groups. *P<0.05 compared with blank; #P<0.05 compared with control; §P<0.05 compared with drug-free NPs.
Abbreviations: NPs, nanoparticles; tPA, tissue-type plasminogen activator.
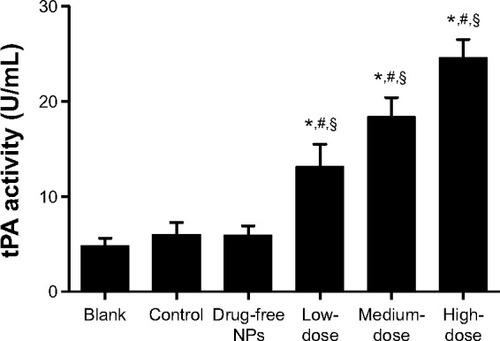
Figure 7 tPA mRNA expression (A), PAI-1 mRNA expression (B), and the ratio of protein expression level of tPA/PAI (C) in peritoneal tissues.
Notes: High, medium and low dose groups were administered with 10, 5 and 2.5 mg/kg Tan IIA-NPs via tail vein injection, respectively. Relative expression levels of tPA and PAI-1 mRNAs are normalized against β-actin. The ratio of protein expression level of tPA/PAI was detected by enzyme-linked immunosorbent assay and the ratio was evaluated using the following formula: ratio of tPA/PAI = (level of tPA protein/total protein)/(level of PAI protein/total protein). Results are expressed as a percentage of controls and shown as mean ± standard deviation (n=5). *P<0.05 compared with blank; #P<0.05 compared with control; §P<0.05 compared with drug-free NPs.
Abbreviations: NPs, nanoparticles; tPA, tissue-type plasminogen activator.
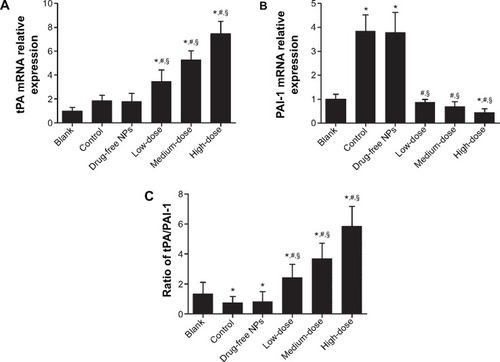
Figure 8 TGF-β1 expression in the peritoneal tissues after 7 days of treatment, detected by immunohistochemistry.
Notes: High, medium and low dose groups were administered with 10, 5 and 2.5 mg/kg Tan IIA-NPs via tail vein injection, respectively. Representative images (at 200× magnification) of peritoneal tissues that were stained immunohistochemically with anti-TGF-β1 antibody. (A) Blank control group. (B) Control group. (C) Drug-free group. (D) Low-dose group. (E) Medium-dose group. (F) High-dose group. (G) Quantitative assay of OD from five randomly selected fields. The results are presented as mean ± standard deviation (n=5). *P<0.05 compared with blank; #P<0.05 compared with control; §P<0.05 compared with drug-free NPs.
Abbreviations: NPs, nanoparticles; OD, optic density; TGF-β1, transforming growth factor-β1.
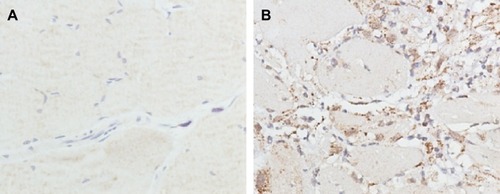
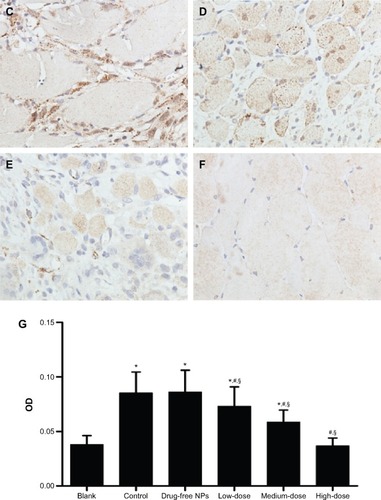
Figure 9 Collagen I expression in the peritoneal tissues after 7 days of treatment, detected by immunohistochemistry.
Notes: High, medium and low dose groups were administered with 10 mg/kg, 5 mg/kg and 2.5 mg/kg Tan IIA-NPs via tail vein injection, respectively. Representative images (at 200× magnification) of peritoneal tissues that were stained immunohistochemically with anti-collagen I antibody. (A) Blank control group. (B) Control group. (C) Drug-free group. (D) Low-dose group. (E) Medium-dose group. (F) High-dose group. (G) Quantitative assay of OD from five randomly selected fields. The results are presented as mean ± standard deviation (n=5). *P<0.05 compared with blank; #P<0.05 compared with control; §P<0.05 compared with drug-free NPs.
Abbreviations: NPs, nanoparticles; OD, optic density.
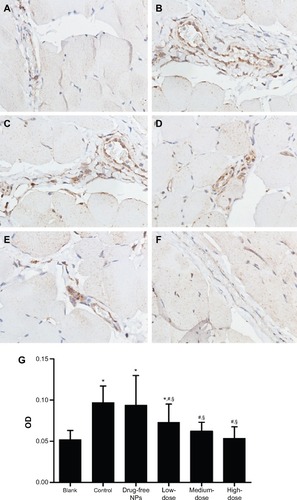
Figure 10 Effect of Tan IIA-NPs on wound healing in the model of anastomotic healing.
Notes: The results are presented as mean ± standard deviation (n=5). High- (n=5), medium- (n=5), and low-dose (n=5) groups showed no significance in burst pressure compared with the control and drug-free NP groups.
Abbreviations: NPs, nanoparticles; Tan IIA-NPs, tanshinone IIA liquid NPs.
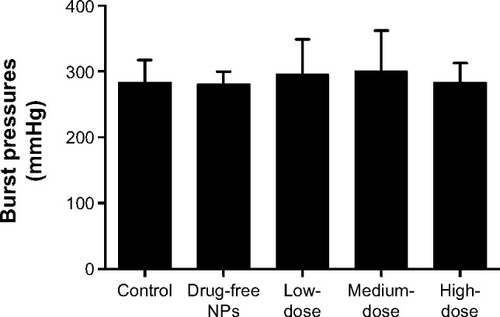
Figure 11 Effect of TGF-β1 on the ratio of tPA/PAI-1 in HMrSV5 cells.
Notes: (A) Change of the ratio of tPA/PAI-1 induced by different concentrations of TGF-β1 for 4 hours. (B) Change of the ratio of tPA/PAI-1 induced by 9 pmol/L TGF-β1 at 0.5-, 2-, and 4-hour points. Data are expressed as mean ± standard deviation (n=3). *P<0.05 compared with control.
Abbreviations: PAI-1, plasminogen activator inhibitor-1; TGF-β1, transforming growth factor-β1; tPA, tissue-type plasminogen activator.
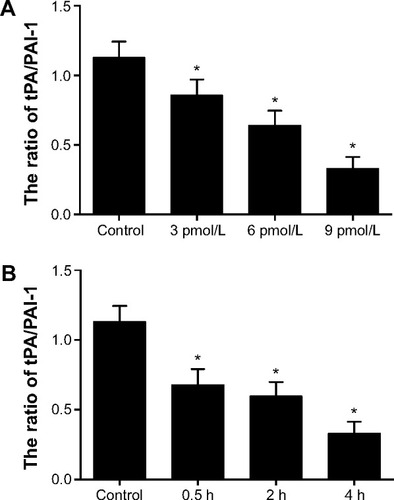
Figure 12 Effect of free-Tan IIA (A) and Tan IIA-NPs (B) on the ratio of tPA/PAI-1 in HMrSV5 cells induced by TGF-β1.
Notes: High, medium and low dose groups were treated with 20, 10, and 5 μg/mL Tan IIA-NPs, respectively. And free-Tan IIA group was treated with 20 μg/mL Tan IIA. Data are expressed as mean ± standard deviation (n=3). *P<0.05 compared with control; #P<0.05 compared with model; §P<0.05 compared with blank.
Abbreviations: NPs, nanoparticles; Tan IIA, tanshinone IIA; Tan IIA-NPs, Tan IIA liquid NPs; PAI-1, plasminogen activator inhibitor-1; TGF-β1, transforming growth factor-β1; tPA, tissue-type plasminogen activator.
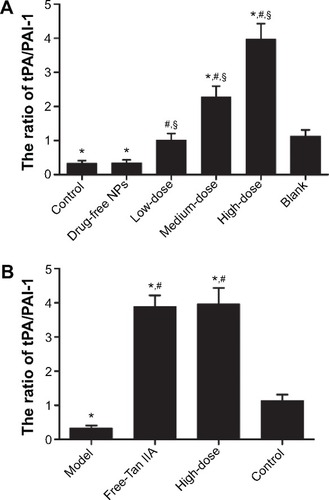
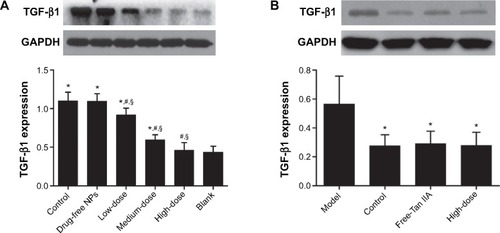
Figure 13 Effect of Tan IIA-NPs (A) and free-Tan IIA (B) on the TGF-β1 protein expression in HMrSV5 cells.
Notes: High, medium and low dose groups were treated with 20, 10, and 5 μg/mL Tan IIA-NPs, respectively. And free-Tan IIA group was treated with 20 μg/mL Tan IIA. Data are expressed as mean ± standard deviation (n=3). *P<0.05 compared with blank; #P<0.05 compared with control; §P<0.05 compared with drug-free NPs.
Abbreviations: NPs, nanoparticles; Tan IIA, tanshinone IIA; Tan IIA-NPs, Tan IIA liquid NPs; TGF-β1, transforming growth factor-β1.
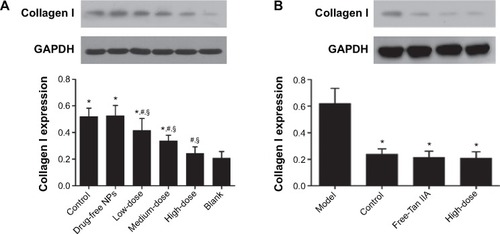
Figure 14 Effect of Tan IIA-NPs (A) and free-Tan IIA (B) on collagen I protein expression in HMrSV5 cells.
Notes: High, medium and low dose groups were treated with 20, 10, and 5 μg/mL Tan IIA-NPs, respectively. And free-Tan IIA group was treated with 20 μg/mL Tan IIA. Data are expressed as mean ± standard deviation (n=3). *P<0.05 compared with blank; #P<0.05 compared with control; §P<0.05 compared with drug-free NPs.
Abbreviations: NPs, nanoparticles; Tan IIA, tanshinone IIA; Tan IIA-NPs, Tan IIA liquid NP; TGF-β1, transforming growth factor-β1.