Figures & data
Figure 1 Scanning electron microscopy showing the morphology of the PLGA NPs.
Abbreviations: NPs, nanoparticles; PLGA, poly(lactide-co-glycolide).
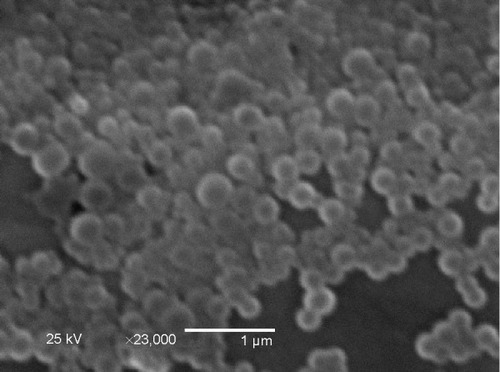
Table 1 Effect of the ratio of water to ethanol on the characteristics of composite microcapsules
Figure 2 Morphology of the PLGA NP composite microcapsules at varying ratios of water to ethanol of 1:3 (A), 1:4 (B), and 1:5 (C).
Abbreviations: NP, nanoparticle; PLGA, poly(lactide-co-glycolide).
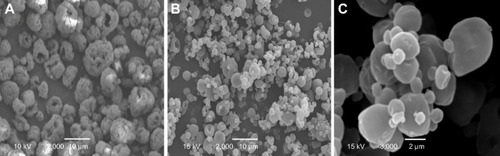
Figure 3 Cumulative release of insulin from the PLGA NPs and PLGA NP composite microcapsules.
Abbreviations: NP, nanoparticles; PLGA, poly(lactide-co-glycolide).
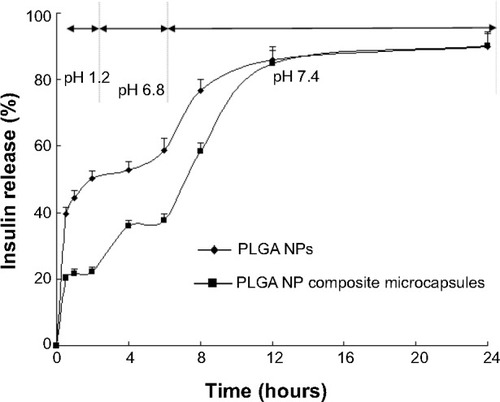
Figure 4 Scanning electron micrographs of the centrifuged microcapsules at determined point during in vitro release (A) 2 h, pH 1.2; (B) 6 h, pH 6.8; (C) 12 h, pH 7.4.
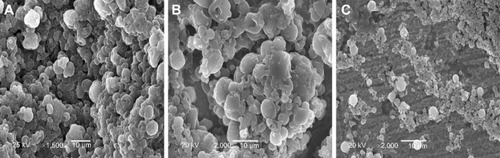
Figure 5 Disposition of coumarin-6 microcapsules in the gastrointestinal tract at different time after oral administration. (A): 4 h, ileum; (B) 6 h, ileum; (C) 6 h, colon; (D) 12 h, colon.
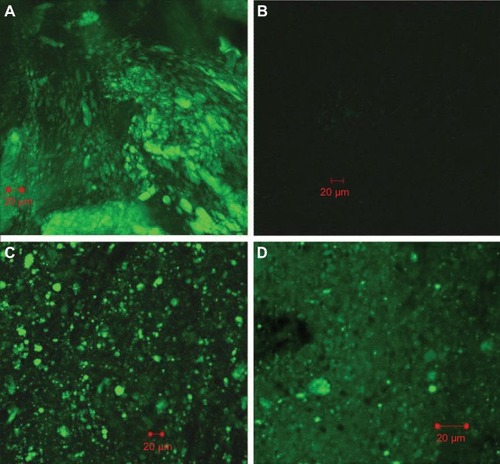
Figure 6 Biological activity of normal insulin, insulin extracted from the Ins-S.O-Comp PLGA NPs and insulin extracted from PLGA NP composite microcapsules. Data are the mean ± S.D. (n=6).
Abbreviations: Ins–S.O-Comp, insulin–S.O complex; NPs, nanoparticles; PLGA, poly(lactide-co-glycolide).
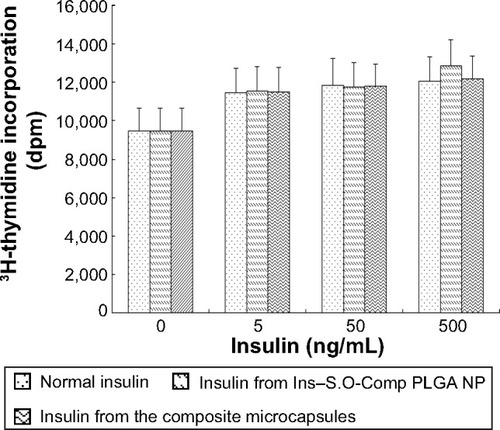
Figure 7 Confocal laser scanning microscopy image of Peyer’s patches cross-sections prepared 4 h after oral administration of coumarin-6-loaded PLGA NP composite microcapsules.
Abbreviations: NP, nanoparticle; PLGA, poly(lactide-co-glycolide).
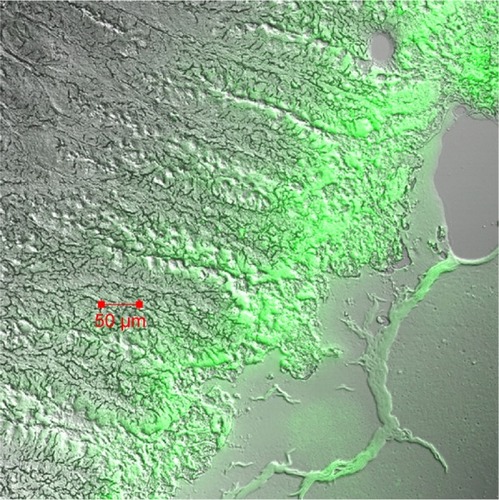
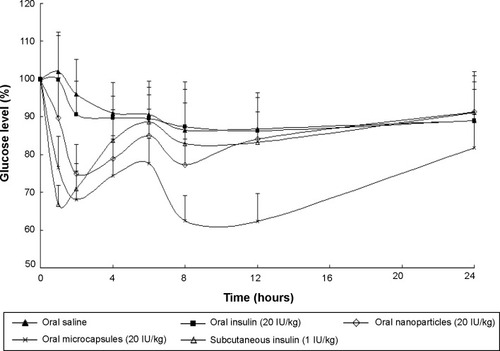
Figure 8 Blood glucose level with time after administration of various samples. Data represent the mean ± SD (n=6).