Figures & data
Figure 1 Characterization of Al2O3NPs.
Notes: (A) TEM image; (B) size distribution (percentage, %) of Al2O3NPs, as generated by TEM imaging.
Abbreviations: Al2O3NPs, alumina nanoparticles; TEM, transmission electron microscopy.
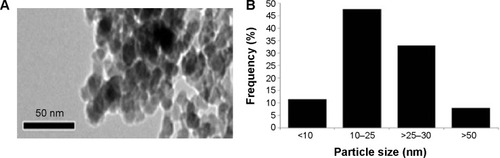
Figure 2 Morphology of HepG2 cells.
Notes: (A) Control HepG2 cells. HepG2 cells were treated with 450 μg/mL of Al2O3NPs for (B) 24 hours and (C) 48 hours. Scale bar: 100 μm.
Abbreviations: Al2O3NPs, alumina nanoparticles; HepG2, human hepatocarcinoma cells.
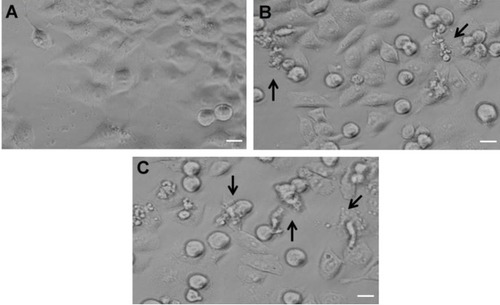
Figure 3 Cytotoxicity of Al2O3NPs toward HepG2 cells after treatment for 24 hours and 48 hours, as measured by the (A) MTT and (B) NRU tests.
Notes: Each value represents the mean ± SEM of three experiments. *P<0.05 vs control.
Abbreviations: Al2O3NPs, alumina nanoparticles; HepG2, human hepatocarcinoma cells; NRU, neutral red uptake; SEM, standard error of the mean.
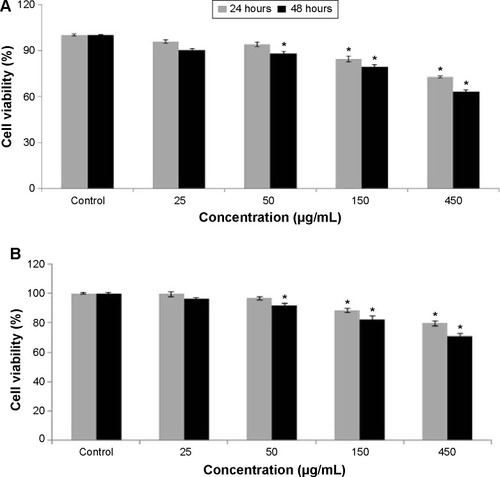
Figure 4 Al2O3NP-induced ROS levels in HepG2 cells.
Notes: (A) Control cells. HepG2 cells incubated with (B) 150 μg/mL and (C) 450 μg/mL of Al2O3NPs for 48 hours. (D) Percentage ROS production at various doses of Al2O3NPs in HepG2 cells. Each value represents the mean ± SEM of three experiments. *P<0.05 vs control. Scale bar: 50 μm.
Abbreviations: Al2O3NPs, alumina nanoparticles; DCF, 2,7-dichlorofluorescein; HepG2, human hepatocarcinoma cells; ROS, reactive oxygen species; SEM, standard error of the mean.
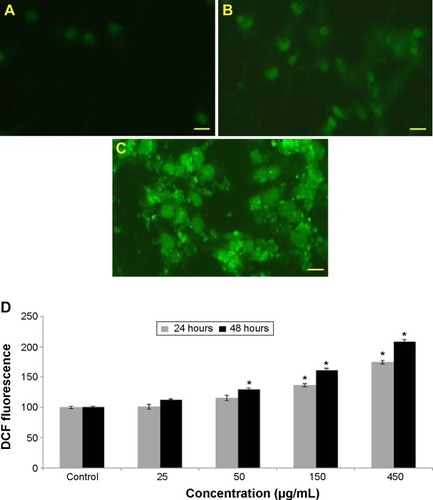
Figure 5 Al2O3NP-induced oxidative stress.
Notes: Levels of (A) LPO, (B) GSH, and (C) SOD in HepG2 cells after treatment with Al2O3NPs for 24 hours and 48 hours. Each value represents the mean ± SEM of three experiments. *P<0.05 vs control.
Abbreviations: Al2O3NPs, alumina nanoparticles; GSH, reduced glutathione; HepG2, human hepatocarcinoma cells; LPO, lipid peroxidation; MDA, malondialdehyde; SEM, standard error of the mean; SOD, superoxide dismutase.
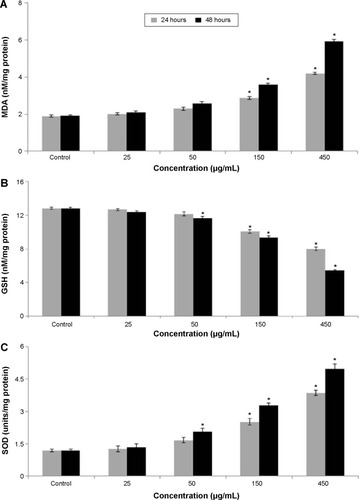
Figure 6 Chromosomal condensation and induction of caspase-3 activity in HepG2 cells after treatment with Al2O3NPs.
Notes: (A) Control. Cells treated with 150 μg/mL of Al2O3NPs for (B) 24 hours and (C) 48 hours. (D) Caspase-3 activity. Each value represents the mean ± SEM of three experiments. *P<0.05 vs control. Scale bar: 50 μm.
Abbreviations: Al2O3NPs, alumina nanoparticles; HepG2, human hepatocarcinoma cells; SEM, standard error of the mean.
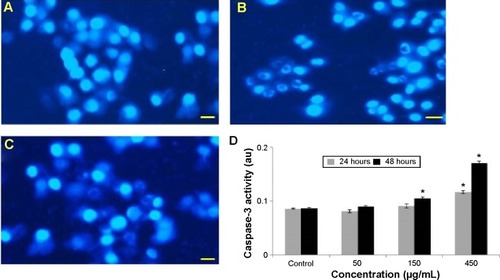
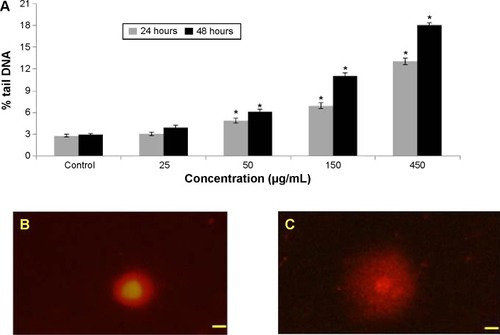
Figure 7 DNA lesions in HepG2 cells due to Al2O3NPs.
Notes: (A) Tail DNA (percentage). (B) Control cells. (C) HepG2 cells treated with 150 μg/mL of Al2O3NPs for 48 hours. Each value represents the mean ± SEM of three experiments. *P<0.05 vs control. Scale bar: 20 μm.
Abbreviations: Al2O3NPs, alumina nanoparticles; HepG2, human hepatocarcinoma cells; SEM, standard error of the mean.