Figures & data
Figure 1 Synthesis of PEI/NONOate, followed by NO/PPNPs fabrication.
Notes: (A) Synthesis of PEI/NONOate and (B) fabrication of NO/PNNPs.
Abbreviations: NONOate, diazeniumdiolate; NO, nitric oxide; PLGA, poly(lactic-co-glycolic acid); PEI, polyethylenimine; NPs, nanoparticles; THF, tetrahydrofuran; NO/PPNPs, NO-releasing PLGA-PEI nanoparticles; PVA, poly(vinyl alcohol); DCM, dichloromethane; NaOCH3, sodium methoxide; MeOH, methanol.
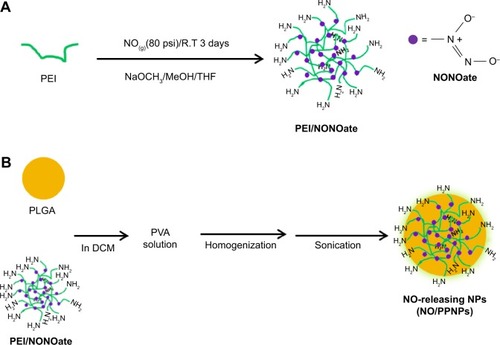
Figure 2 Characterization of PEI/NONOate by 1H NMR and FTIR.
Notes: (A) 1H NMR spectra of PEI and PEI/NONOate. (B) FTIR spectra of PEI/NONOate, PLGA, PPNPs, and NO/PPNPs. The red circles in A and B refer to proton signals of methylene groups and diazeniumdiolates group.
Abbreviations: 1H NMR, proton nuclear magnetic resonance; PEI, polyethylenimine; PLGA, poly(lactic-co-glycolic acid); FTIR, Fourier transform infrared spectroscopy; PPNPs, PLGA-PEI nanoparticles; NO/PPNPs, NO-releasing PLGA-PEI nanoparticles; NO, nitric oxide; NONOate, diazeniumdiolate.
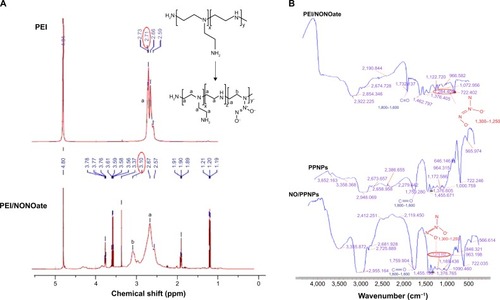
Figure 3 Characterization of PEI/NONOate by UV-Vis spectra.
Notes: (A) UV-Vis absorption of PEI/NONOate (violet line), PEI/NONOate with Griess reagent (green line). (B) UV-Vis spectra of PEI/NONOate in different concentrations. (C) UV-Vis spectra of PEI/NONOate in DPBS at 37°C at different times.
Abbreviations: NED, N-1-naphthylethylenediamine; UV-Vis, ultraviolet-visible; PEI, polyethylenimine; DPBS, Dulbecco’s phosphate-buffered saline; NONOate, diazeniumdiolate.
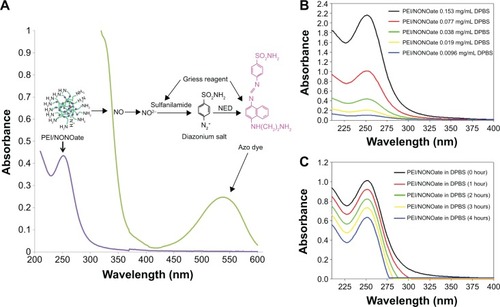
Table 1 Characterizations of NPs
Figure 4 Characterization of nanoparticles.
Notes: (A) SEM images of PPNPs and NO/PPNPs, bars represent 500 nm. (B) Size distribution of PPNPs and NO/PPNPs.
Abbreviations: SEM, scanning electron microscopy; PLGA, poly(lactic-co-glycolic acid); PEI, polyethylenimine; PPNPs, PLGA-PEI nanoparticles; NO/PPNPs, NO-releasing PLGA-PEI nanoparticles; NONOate, diazeniumdiolate; NO, nitric oxide.
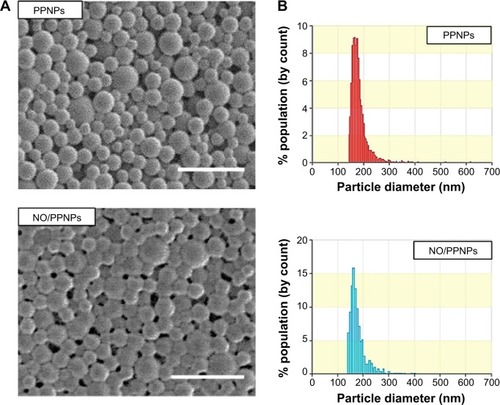
Figure 5 In vitro release profile of PEI/NONOate and NO/PPNPs.
Notes: All samples were placed in DPBS at 37°C; data presented are mean ± standard deviation; n=3.
Abbreviations: PEI, polyethylenimine; PPNPs, PLGA-PEI nanoparticles; NO/PPNPs, NO-releasing PLGA-PEI nanoparticles; NONOate, diazeniumdiolate; NO, nitric oxide; PLGA, poly(lactic-co-glycolic acid); DPBS, Dulbecco’s phosphate-buffered saline; h, hour(s).
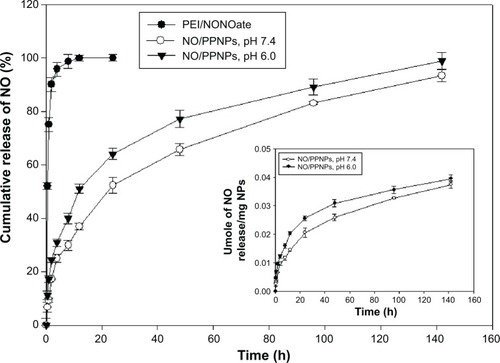
Figure 6 Antibacterial activity of PPNPs and NO/PPNPs against MRSA and Pseudomonas aeruginosa.
Notes: The number of CFU (A) of MRSA and (B) of P. aeruginosa. Data shown are mean ± standard deviation; n=3.
Abbreviations: PLGA, poly(lactic-co-glycolic acid); PEI, polyethylenimine; PPNPs, PLGA-PEI nanoparticles; NO/PPNPs, NO-releasing PLGA-PEI nanoparticles; MRSA, methicillin-resistant Staphylococcus aureus; CFU, colony forming units; NO, nitric oxide.
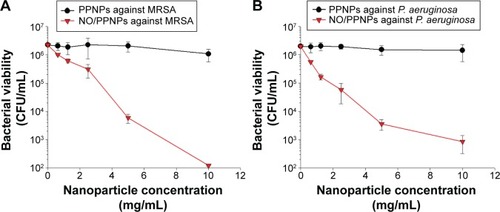
Figure 7 Confocal microscopy images and the percent (%) survival of MRSA (left panel) and Pseudomonas aeruginosa (right panel) after 24 hours of treatment with nanoparticles at different concentrations.
Notes: (A) PPNPs, (B) NO/PPNPs, (C) percent (%) survival against MRSA and (D) percent (%) survival against P. aeruginosa. Syto-9 fluorescence (green) indicates intact membrane of healthy bacteria, PI fluorescence (red) indicates membrane destruction and cell death. Bacterial survival at each point is presented as a percentage relative to the control group (buffer alone). Data shown are mean ± standard deviation; n=3. (A and B) Bars represent 20 μm.
Abbreviations: PLGA, poly(lactic-co-glycolic acid); PEI, polyethylenimine; PPNPs, PLGA-PEI nanoparticles; NO/PPNPs, NO-releasing PLGA-PEI nanoparticles; MRSA, methicillin-resistant Staphylococcus aureus; PI, propidium iodide; NO, nitric oxide.
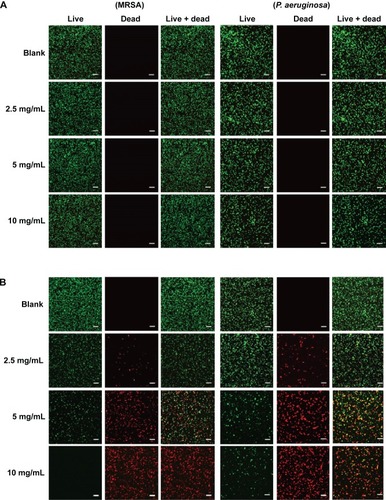
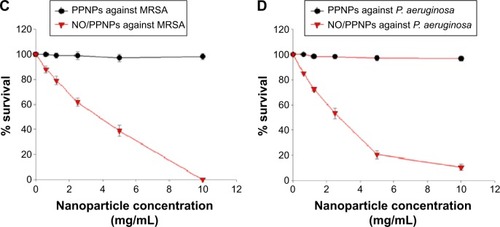
Figure 8 Adhesion of PLGA NPs, PPNPs, and NO/PPNPs to bacteria.
Notes: (A) MRSA and (B) Pseudomonas aeruginosa. Nanoparticles were incubated with bacteria for 2 hours and images were obtained using a confocal microscope. Bacterial membrane (green) stained with Syto-9 and nanoparticles (red) labeled with nile red for visualization.
Abbreviations: PLGA, poly(lactic-co-glycolic acid); PEI, polyethylenimine; PPNPs, PLGA-PEI nanoparticles; NO/PPNPs, NO-releasing PLGA-PEI nanoparticles; MRSA, methicillin-resistant Staphylococcus aureus; NO, nitric oxide; NPs, nanoparticles.
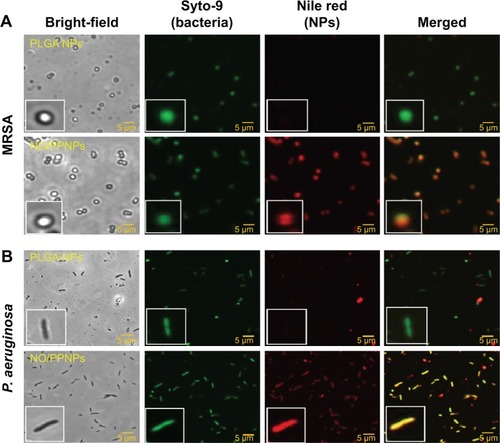
Figure 9 Viability (%) of L929 mouse fibroblast cells following 24-hour exposure to nanoparticles at different concentrations (n=8).
Abbreviations: PLGA, poly(lactic-co-glycolic acid); PEI, polyethylenimine; NPs, nanoparticles; PPNPs, PLGA-PEI nanoparticles; NO/PPNPs, NO-releasing PLGA-PEI nanoparticles; NO, nitric oxide.
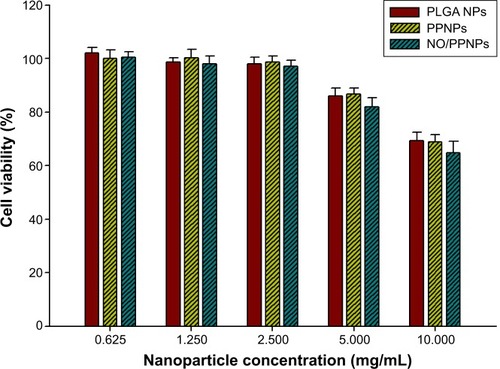
Figure 10 Wound healing assay in mice.
Notes: (A) Representative photographs of MRSA-infected wounds of BALB/c mice treated with or without NO/PPNPs. (B) Area reduction (%) profiles of the wounds. Values are mean ± standard deviation, n=4, *P<0.05 compared with untreated group.
Abbreviations: MRSA, methicillin-resistant Staphylococcus aureus; NO/PPNPs, NO-releasing PLGA-PEI nanoparticles; PLGA, poly(lactic-co-glycolic acid); PEI, polyethylenimine; NO, nitric oxide.
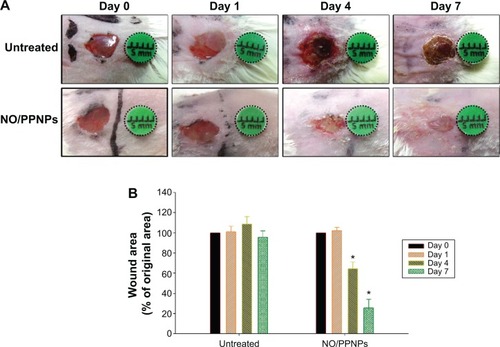
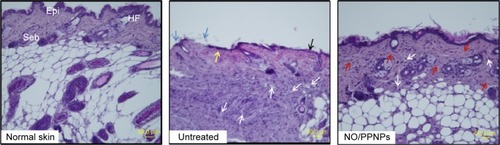
Figure 11 Histological sections of normal skin, untreated, and NO/PPNPs stained with hematoxylin and eosin.
Notes: Histological analysis of BALB/c mice at day 7, scale bar =50 μm. The arrows colored with black, blue, yellow, white, and red indicate edema, ulceration, early epithelialization, mononuclear inflammatory cell, and fibroblast cell, respectively.
Abbreviations: NO/PPNPs, NO-releasing PLGA-PEI nanoparticles; PLGA, poly(lactic-co-glycolic acid); PEI, polyethylenimine; NO, nitric oxide; HF, hair follicles; Epi, epidermis; Seb, sebaceous glands.