
Figures & data
Table 1 Particle size and zeta potential in different solvents
Figure 1 Morphology and size distribution of the PLGA NPs.
Notes: (A) TEM image of PLGA NPs and size distribution in water of (B) unloaded PLGA NPs, and (C) PLGA-BSA NPs.
Abbreviations: PLGA, poly(lactic-co-glycolic) acid; NPs, nanoparticles; TEM, transmission electron microscope; BSA, bovine serum albumin; PDI, polydispersity index.
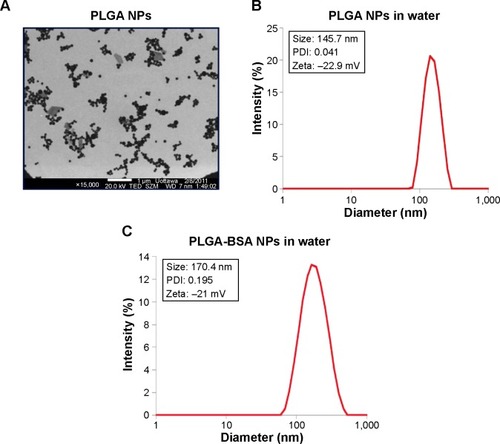
Figure 2 Cellular uptake of BSA encapsulated into PLGA NPs analyzed by flow cytometry.
Notes: THP-1 monocyte-derived macrophages were treated with different concentrations of PLGA-FITC-BSA NPs for 3 hours, and fluorescence intensity was measured by flow cytometry. (A) Histograms showing fluorescence intensity at different NPs concentrations of a representative experiment. (B) Mean ± SEM fluorescence intensity of at least two experiments.
Abbreviations: PLGA, poly(lactic-co-glycolic) acid; NPs, nanoparticles; BSA, bovine serum albumin; FITC, fluorescein isothiocyanate; SEM, standard error of the mean; FU, fluorescence unit.
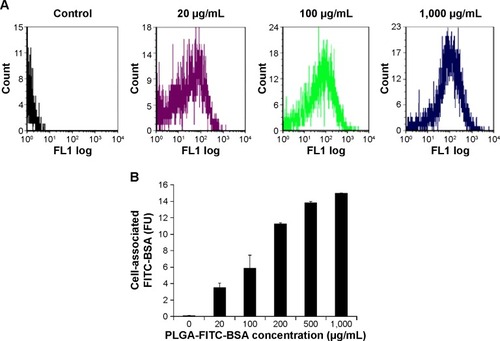
Figure 3 Flow cytometry analysis of cellular uptake.
Notes: Monocyte-derived macrophages were exposed to various concentrations of fluorescent BSA alone or PLGA-FITC-BSA NPs for 3 hours. Then cells were washed and analyzed by flow cytometry.
Abbreviations: PLGA, poly(lactic-co-glycolic) acid; NPs, nanoparticles; BSA, bovine serum albumin; FITC, fluorescein isothiocyanate; FU, fluorescence unit.
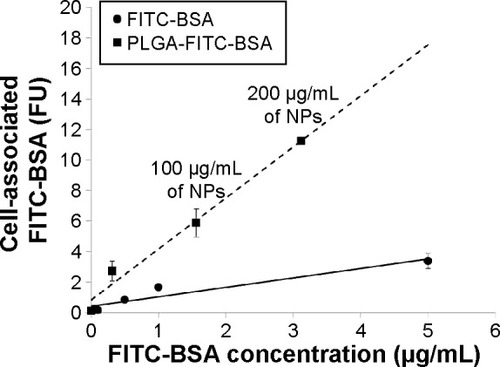
Figure 4 Confocal microscopy analysis of internalization of fluorescent BSA in live monocyte-derived macrophage cells.
Notes: (A) Untreated control THP-1 MDM cells. THP-1 MDM cells were treated for 3 hours with (B) 1 µg/mL of FITC-BSA alone (equivalent amount of BSA found in 64 µg/mL of PLGA-FITC-BSA NPs), (C) 20 µg/mL, (D) 100 µg/mL, (E) 500 µg/mL, and (F) 1,000 µg/mL of PLGA-FITC-BSA NPs. Images are representative of three separate experiments. Magnification 630×. Green fluorescence: FITC-BSA.
Abbreviations: BSA, bovine serum albumin; MDM, monocyte-derived macrophages; PLGA, poly(lactic-co-glycolic) acid; NPs, nanoparticles; FITC, fluorescein isothiocyanate.
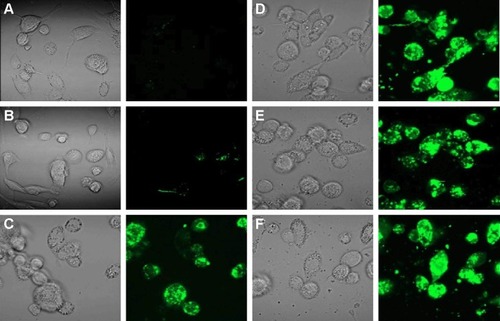
Figure 5 Effects of NPs on cell viability of THP-1 MDMs.
Notes: Cells were treated with different concentrations of (A) PLGA and (B) PLGA-BSA NPs for 48 hours, then washed, and cell viability was determined by the colorimetric CellTiter-Blue® assay. Percentage of cell viability was calculated relative to untreated control cells. Values represent mean ± SEM from at least two experiments (n=4 for PLGA; n=8 for PLGA-BSA).
Abbreviations: NPs, nanoparticles; MDMs, monocyte-derived macrophages; PLGA, poly(lactic-co-glycolic) acid; BSA, bovine serum albumin; SEM, standard error of the mean.
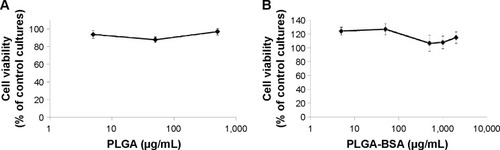
Figure 6 Effects of NPs on neutrophil apoptosis.
Notes: PMNs (10×106 cells/mL) were incubated with buffer (Control), 65 ng/mL GM-CSF, VAA-1, or the indicated concentrations of (A) PLGA NPs, or (B) PLGA-BSA NPs, and apoptosis was assessed by cytology. Results are mean ± SEM (n=3). *Indicates P<0.05 versus the control and ***indicates P<0.001 versus the control.
Abbreviations: NPs, nanoparticles; PMNs, polymorphonuclear neutrophils; GM-CSF, granulocyte-macrophage colony-stimulating factor; VAA-1, Viscum album agglutinin 1; SEM, standard error of the mean; PLGA, poly(lactic-co-glycolic) acid.
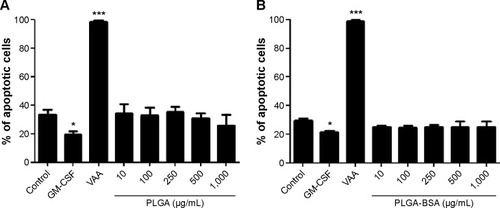
Figure 7 Induction of leukocyte infiltration by PLGA NPs in vivo.
Notes: Murine air pouches were raised in CD-1 mice before the injection of water (control) or the indicated concentrations of (A) PLGA NPs, (B) PLGA-BSA NPs, and (C) BSA protein alone. Exudates were harvested after 6 hours, and the total number of leukocytes was calculated. Results are the mean ± SEM (n≥4). *P<0.05 versus the control, **P<0.01 versus the control.
Abbreviations: PLGA, poly(lactic-co-glycolic) acid; NPs, nanoparticles; BSA, bovine serum albumin; SEM, standard error of the mean.
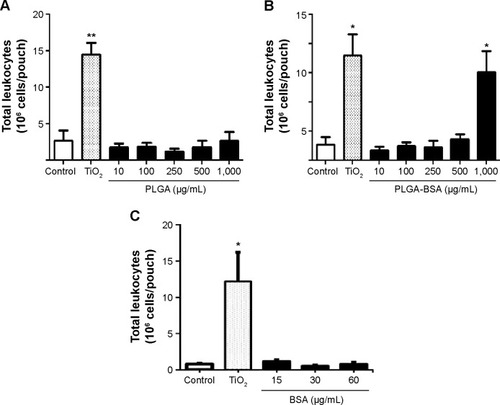
Figure 8 Analysis of leukocyte subsets attracted in the air pouches.
Notes: Murine air pouches were raised in CD-1 mice before the injection of water (control) or the indicated concentrations of (A) PLGA NPs, (B) PLGA-BSA NPs, or (C) BSA protein alone. Exudates were harvested after 6 hours and the cell populations were identified by cytology. Results are the means ± SEM (n≥4). *P<0.05 versus the control, **P<0.01 versus the control, ***P<0.001 versus the control by ANOVA. Numbers in parentheses are the number of cells ×106.
Abbreviations: PLGA, poly(lactic-co-glycolic) acid; NPs, nanoparticles; BSA, bovine serum albumin; SEM, standard error of the mean; PMNs, polymorphonuclear neutrophils
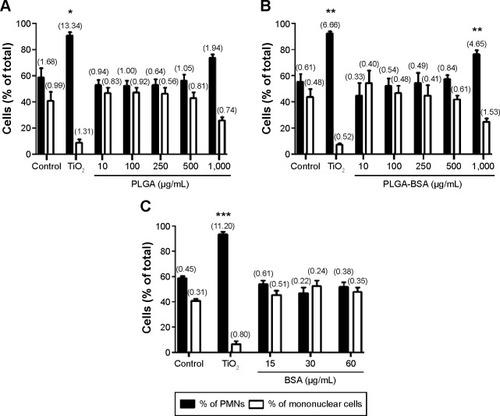
Figure S1 Stability of the nanosuspensions.
Notes: THP-1 monocyte-derived macrophages were treated for 3 hours with 100 µg/mL of PLGA-FITC-BSA NPs stored at 4°C for the indicated period of time and fluorescence was analyzed by flow cytometry. Values represent mean fluorescence intensity ± SEM from at least two experiments (n=4–6). Differences between groups were not found statistically significant at P=0.05.
Abbreviations: PLGA, poly(lactic-co-glycolic) acid; FITC, fluorescein isothiocyanate; BSA, bovine serum albumin; NPs, nanoparticles; SEM, standard error of the mean; FU, fluorescence unit.
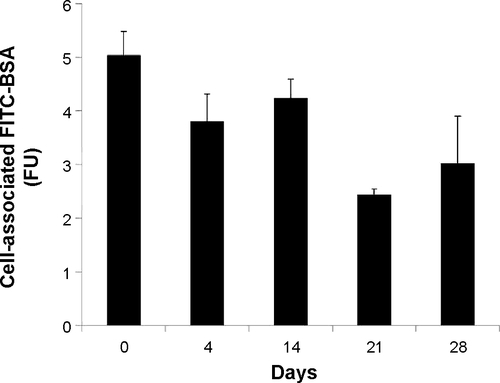
Table S1 Effects of PLGA nanoparticles on cytokine secretion