Figures & data
Figure 1 X-ray photoelectron spectra of iron(+3)–manganese-promoted sulfated zirconia.
Notes: (A) O2− (1s); (B) Zr4+ (3d5/2); (C) Fe3+ (S 2p); (D) for Fe(111) (2p3/2, 2p1/2); and (E) Mn4+ (2p3/2, 2p1/2).
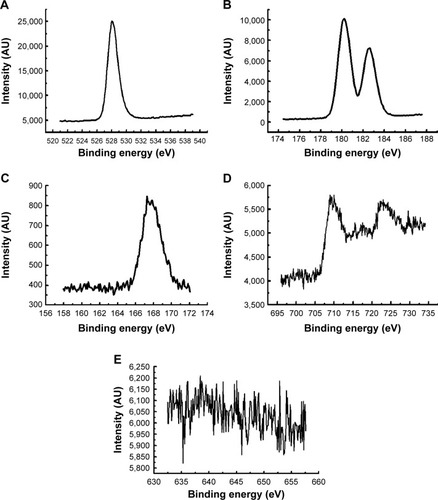
Figure 2 Thermogravimetric analysis–differential temperature curves thermograph of the iron(+3)–manganese-promoted sulfated zirconia sample.
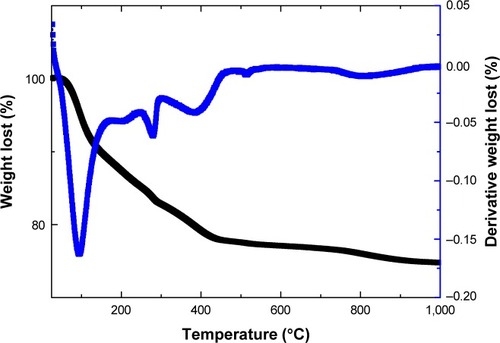
Figure 3 Fourier transform infrared spectrum of iron(+3)–manganese-promoted sulfated zirconia sample.
Notes: (a) Stretching and (b) bending of the OH group; (c) symmetric stretching of the O–S–O bond; and (d) asymmetric stretching frequency of the O=S=O bond.
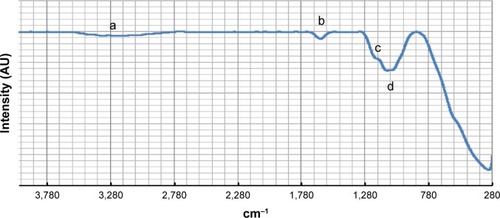
Figure 4 X-ray diffraction pattern of the Fe3+-Mn4+-SO4/ZrO2 sample calcined at 650°C for 5 hours.
Note: (a) Tetragonal phase of zirconia.
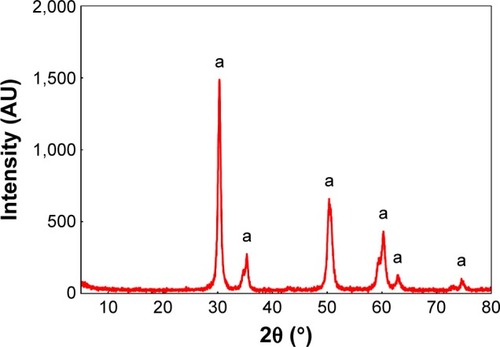
Figure 5 Transmission electron microscopy image of the Fe3+-Mn4+-SO4/ZrO2 sample calcined at 650°C for 5 hours.
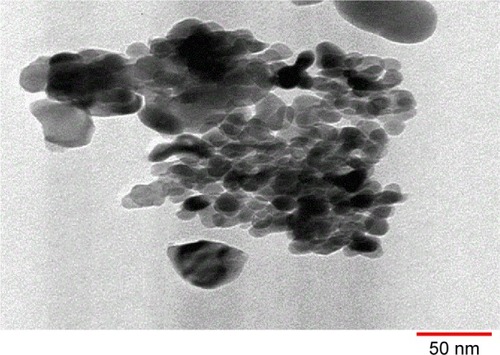
Figure 6 Iron–manganese-promoted sulfated zirconia NP and chemotherapeutic effects on the viability of treated cells, which were evaluated through mitochondrial activity using a 3-(4,5-dimethylthiazol-2-yl)-2,5-diphenyltetrazolium bromide assay.
Notes: Mean ± standard deviation (n=3 wells/treatment). *P<0.05 compared with the untreated cells.
Abbreviations: HUVEC, human umbilical vein endothelial cell; NP, nanoparticle.
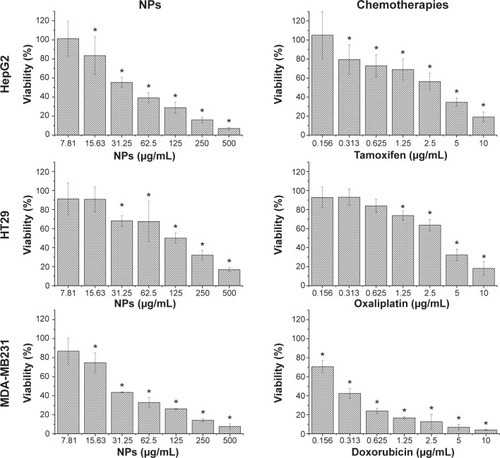
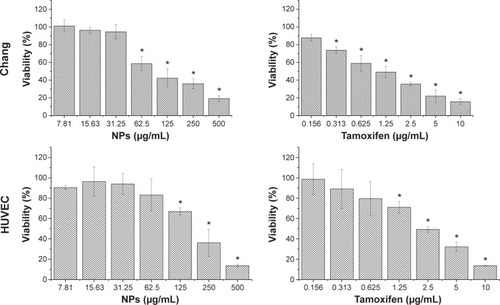
Table 1 Comparison of IC50 values for HepG2 cells, HT29 cells, MDD-MB231 cells, Chang cells, and HUVECs obtained from MTT assay following exposure to iron–manganese-promoted sulfated zirconia nanoparticles and chemotherapies for 72 hours
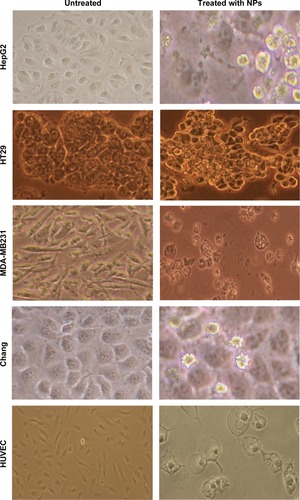
Figure 7 The morphological changes of HepG2 cells, HT29 cells, MDD-MB231 cells, Chang cells, and HUVECs treated with iron–manganese-promoted sulfated zirconia nanoparticles at their respective IC50 concentrations for 72 hours..
Abbreviations: HUVEC, human umbilical vein endothelial cell; IC50, concentration of drug needed to inhibit cell growth by 50%; NPs, nanoparticles.