Figures & data
Figure 1 Grafting as a function of dose at a reaction temperature of 50°C.
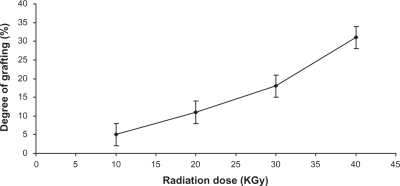
Figure 2 FTIR spectra of the nongrafted polystyrene (upper) and grafted polystyrene treated with γ-rays (radiation dose: 40 KGy) (lower).
Abbreviations: FTIR, Fourier transform infrared spectroscopy.
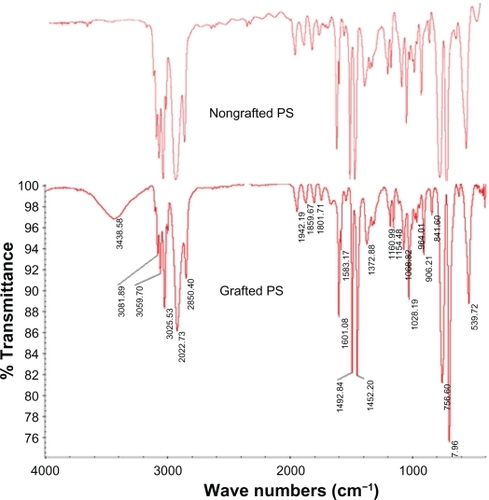
Figure 3 A) Scanning electron microscopy of nongrafted polystyrene. Magnification 5000×. B) Scanning electron microscopy of grafted polystyrene under 10 KGy. Magnification 1000× (scale: 20 μm). C) Magnification 5000× (scale: 5 μm).
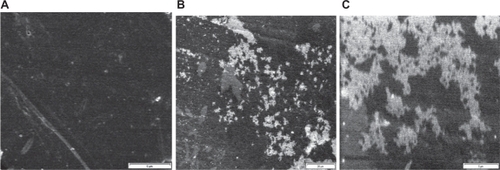
Figure 4 Atomic force microscopy of grafted polystyrene under 10 KGy (scale: 1 × 1 μm).
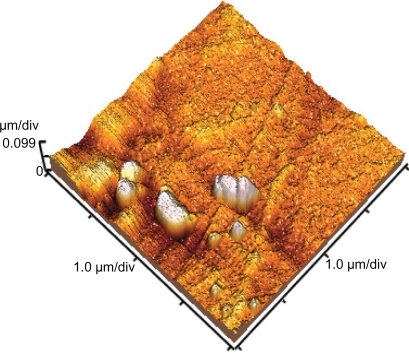
Figure 5 Scanning electron microscopy of grafted polystyrene under 20 KGy. A) Magnification 1000× (scale: 20 μm). B) Magnification 5000× (scale: 5 μm).
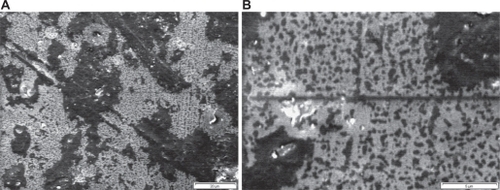
Figure 6 Atomic force microscopy of grafted polystyrene under 20 KGy (scale: 1 × 1 μm).
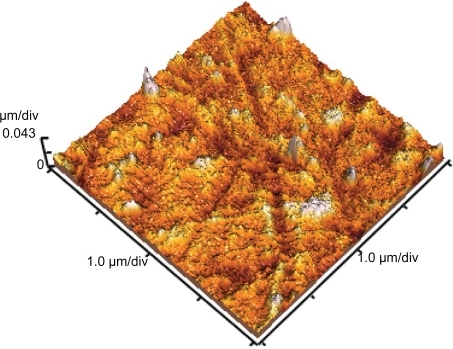
Figure 7 Scanning electron microscopy of grafted polystyrene under 30 KGy. A) Magnification 1000× (scale: 20 μm). B) Magnification 5000× (scale: 5 μm).
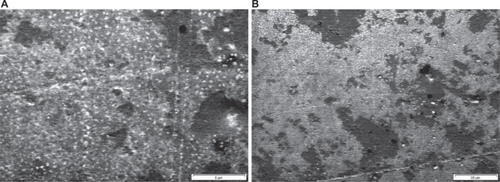
Figure 8 Atomic force microscopy of grafted polystyrene under 30 KGy (scale: 1 × 1 μm).
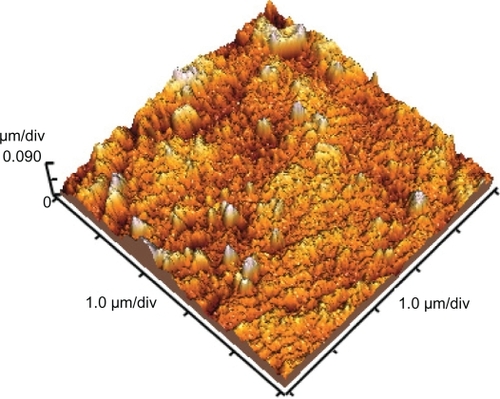
Figure 9 Scanning electron microscopy of grafted polystyrene under 40 KGy. A) Magnification 1000× (scale: 20 μm). B) Magnification 5000× (scale: 5 μm).
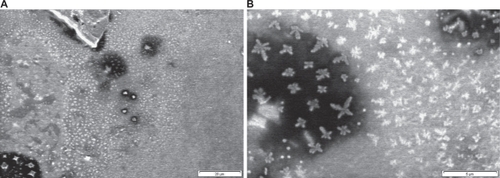
Figure 10 Atomic force microscopy of grafted polystyrene under 30 KGy (scale: 1 × 1 μm).
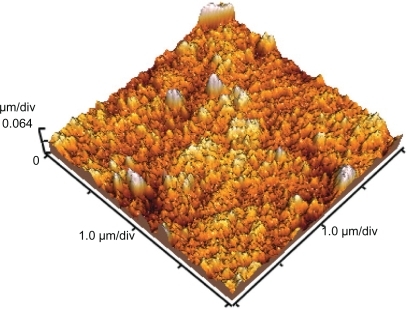
Table 1 Contact angle for normal and grafted samples
Figure 11 Differential scanning calorimetry spectra of the grafted polystyrene by γ-ray (radiation dose: 40 KGy).
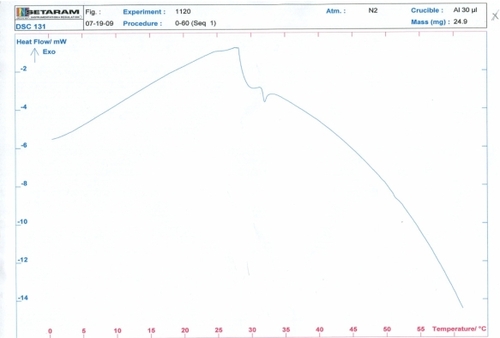
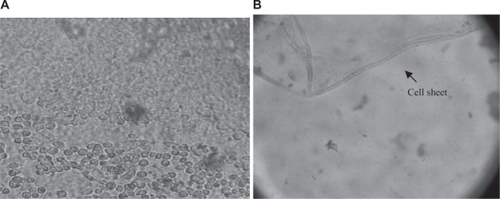
Figure 12 A) The growth of fibroblast cells on the grafted Petri dish at 37°C. B) the cells detached spontaneously from the grafted sample when the temperature dropped below 10°C.